The Primary Data Center Delta Ts14 min read

The data center is a living, breathing organism. Depending on who we ask, the breath that brings life to the data center could be either electricity or data and that debate is fraught with chicken and egg implications. However, for those of us working around the mechanical fringe of this beast, we will probably say that air carries in refreshment and carries out waste – pretty good definition of “lifeblood.” I make no apologies here to the data center liquid cooling folks, other than to risk rampant confusion by replacing air with liquid and saying that liquid is that lifeblood. That would be correct according to the physics of heat transfer wherein air is just one of many liquids, but it might dampen (tee hee) the dialectic for those folks who stop reading as soon as they are either vindicated or contradicted. Heat removal in the data center is indicated by temperature rises or drops of that “ blood,” which I will call “ ΔT” for the duration of this discussion. As I noted in my introductory piece on this subject a couple of weeks ago, there are meaningful ΔTs everywhere within and around the data center, including:
- Server intake air versus server exhaust air
- Cooling equipment intake (return) air versus cooling equipment exhaust (supply) air
- Economizer scavenger intake versus exhaust
- Economizer scavenger versus data center supply
- Economizer scavenger versus data center return
- Cooling coil intake (EWT) versus cooling coil exhaust (LWT)
- Tower intake versus ambient
- Tower LWT versus ambient
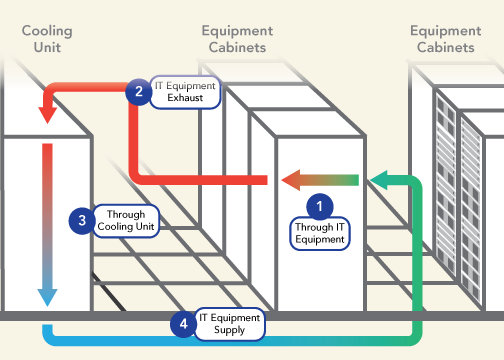
Depending on our tolerance for granularity, this list can get really long, and every ΔT is going to be either directly affected by data center airflow management or in some way be associated with it; however, some of these ΔTs are particularly meaningful indicators of the effectiveness of data center airflow management and resultant overall operational efficiency. Four of these metrics are illustrated below in figure 1. Today’s discussion will focus on the more obvious ΔT #1 and ΔT# 3.
Typically ΔT is discussed in our industry as a single metric or phenomena and, depending on who is doing the talking, that single metric is based on the temperature drop across the cooling equipment or the temperature rise across the IT equipment. According to the naïve observer, those two differentials will be the same. Likewise, according to the passionate efficiency evangelizer, those two differentials SHOULD be the same. In reality, they are not the same and often not even close. There are many reasons why these two values may be different, but those reasons will fall into two categories – the return air to the cooling units is being cooled by bypass airflow, or it has picked up extra heat somewhere along the line from the re-circulated waste air.
There is a fixed relationship between airflow, temperature differential, and heat, shown in Table 1 below, but simply stated as ΔT = 3.1W ÷ CFM, where 3.1 = a constant coefficient at sea level and W = watts and CFM = cubic feet per minute airflow. That coefficient changes for calculations at higher altitudes, for calculations in Celsius, for airflow measurements in liters per second or cubic meters per hour, and for heat measured in kW or BTU. Whatever terms or units are being considered, there is a fixed relationship between these three factors. In actual applications, the ΔT across IT equipment typically ranges from around 20˚F up to around 35˚F, depending on the type of equipment. For example, blade servers will typically produce a higher data center delta T than pizza box servers. The 20˚F temperature rise illustrated in Figure 1 is representative of many commercial 2U rack mount servers. Not too many years ago, the only actual variable in this relationship was the heat load, reflecting the addition or removal of a piece of IT equipment from the data center. That relationship is no longer quite so simple. For example, in data centers where free cooling is employed that may allow 20˚F or 30˚F swings in supply temperature over the course of a day will see increases in server fan speed at the higher temperatures, resulting in lower ΔTs and also increasing the demand of the economizer fans. Likewise, with cloud resources, we can see dramatic changes in load (W) with load shedding, balancing, work transfers between sites to exploit utility demand pricing variations, and not to mention traffic fluctuations in the e-commerce world.
RELATIONSHIP BETWEEN LOAD, AIR FLOW RATE, AND HEAT REMOVAL | ||||||||
IT Equipment ΔT | 15˚F | 20˚F | 25˚F | 30˚F | 35˚F | 40˚F | ||
IT Equipment Load | 2.0 kW | 421 | 316 | 253 | 211 | 181 | 158 | Associated Air Flow Rate (CFM) |
2.5 kW | 527 | 395 | 316 | 263 | 226 | 198 | ||
3.0 kW | 632 | 474 | 379 | 316 | 271 | 237 | ||
3.5 kW | 737 | 553 | 442 | 369 | 316 | 277 | ||
4.0 kW | 843 | 632 | 506 | 421 | 361 | 316 | ||
4.5 kW | 948 | 711 | 569 | 474 | 406 | 356 | ||
5.0 kW | 1053 | 790 | 632 | 527 | 451 | 395 | ||
5.5 kW | 1159 | 869 | 695 | 579 | 497 | 435 | ||
6.0 kW | 1264 | 948 | 758 | 632 | 542 | 474 | ||
6.5 kW | 1369 | 1027 | 822 | 685 | 587 | 514 | ||
7.0 kW | 1475 | 1106 | 885 | 737 | 632 | 553 | ||
7.5 kW | 1580 | 1185 | 948 | 790 | 677 | 593 | ||
8.0 kW | 1685 | 1264 | 1011 | 843 | 722 | 632 | ||
8.5 kW | 1791 | 1343 | 1074 | 895 | 767 | 672 | ||
9.0 kW | 1896 | 1422 | 1138 | 948 | 813 | 711 | ||
9.5 kW | 2001 | 1501 | 1201 | 1001 | 858 | 751 | ||
10.0 kW | 2107 | 1580 | 1264 | 1053 | 903 | 790 | ||
In some cases, particularly when the conversation is being conducted among mechanical or facilities engineering participants, THE ΔT is the temperature drop across the cooling coils, or across whatever is removing the heat from the data center air, such as adiabatic media or energy recovery wheel air-to-air heat exchange. Ideally, this delta should be the same as the delta across the IT equipment, indicating that the cooling resource is perfectly matched to the heat load it is serving. That is the ideal, but only rarely approached. First, it is useful to understand some of the design factors accounting for temperature differences across the cooling resource. Most simply, in legacy DX CRAC units, that temperature drop was typically fixed somewhere in the neighborhood of 18˚F, and there was not much allowance for variation from that baseline ΔT. For example, increases in return air temperature resulted in an associated increase in supply air temperature, so a 5˚F increase in return air temperature might result in a 3˚ or 4˚ increase in the supply temperature; the overall ΔT would increase slightly, but nowhere near the proportion possible with water-cooled coils. Most of the name-brand water-cooled CRAH units today can remove heat equivalent to anywhere from 45˚ up to 65˚F temperature drop across the cooling coils. Given the mathematical relationship between heat, airflow and ΔT previously discussed (CFM = 3.1W/ΔT), the higher ΔT across those coils means we are removing more heat, and therefore the CRAH unit is operating much more efficiently. Normally, we would say that is a good thing, except if the ΔT across the IT load is still only 20˚F, then we are not effectively removing any more heat; rather, we are just accommodating the inefficiency of the overall airflow management scheme. The ΔT across the cooling source is also affected by set points. For example, if there is a lot of bypass airflow it is conceivable (this happens much more frequently than folks will admit outside the friendly confines of their local pub or tavern) that the return air can actually be below the set point and therefore is returned to the data center without any additional heat being removed: ΔT = zero. Furthermore, with a normal return set point, similar to a home or office thermostat setting, the CRAHs will be working to bring the data center temperature down to that set point, resulting in ΔTs which could range from 0 up to over 20˚F. Finally, if the CRAHs are operating with a fixed supply temperature, the ΔT could range from 20˚-35˚ based on the types of servers deployed in that space, or the cooling coils could see less than 10˚F if there is a lot of wasted surplus cooling in the space, up to over 40˚F if there is a cumulative hot air re-circulation effect.
In dynamic environments such as the load variations previously discussed, the facilities ΔT may very well be that control factor to manage airflow volume (fan speed) to match actual IT heat loads, assuming there is a calibrated relationship between the IT ΔT and the cooling equipment cumulative ΔT. For example, when the stabilized room ΔT is 18˚F associated with an IT load ΔT of 21˚F and some activity has precipitated a drop in cooling equipment ΔT to 15˚F, our data center is telling us to turn down the fan speeds of our cooling equipment. Seems pretty straightforward, but not so fast my friends. Our IT load ΔTs are also variables, as noted above, responding to server inlet temperature. Therefore, in data centers employing free cooling and an overly rigid mindset, we could see server inlet temperatures ranging from 64.4˚F to 80.6˚F to stay safely inside the ASHRAE recommended environmental limits, resulting in server fan fluctuations to maximize energy efficiency and to simultaneously maintain acceptable processor temperatures. Furthermore, in free cooling data centers where service level agreements or environmental operating limits are driven by the server manufacturers’ specifications rather than ASHRAE guidelines, those inlet temperatures could vary from 50˚F to 95˚F or wider, resulting in even wider fluctuations in server fan speeds and bigger swings in IT ΔT. These fluctuations in fan speeds result in fluctuations in load ΔT as well, but the data center might not recognize these changes because if the room is being oversupplied or undersupplied with cooling air, those differentials will produce bypass or re-circulation, thereby masking the IT ΔT variations. Therefore, a fan control system driven by ΔT needs to include an algorithm correlating fan speeds to inlet temperature. Ideally, such an algorithm would be based on the fan curve charts of all the different server fans and the server manufacturers’ internal temperature design targets for all the equipment in the data center. Any idea how realistic your chances are for obtaining that information? Even if you got that information, any idea what I would charge you to write those algorithms? That being the case, you can get close enough to be very effective and efficient using the information from the band charts on pages 24 and 25 in ASHRAE’s Thermal Guidelines for Data Processing Environments, 4th edition.
Even more critical than accommodating load variations to manage airflow by a variable ΔT is following good airflow management practices to minimize the difference between the IT ΔT and the facilities ΔT. The key factors affecting the Δ between these ΔTs are the IT supply ΔT and IT exhaust ΔT, which are determined by control, or lack thereof, of bypass and re-circulation. Next time, I will be discussing these relationships and how to manage them.

Ian Seaton
Data Center Consultant
Let's keep in touch!
Airflow Management Awareness Month
Free Informative webinars every Tuesday in June.
0 Comments