The Secondary Data Center Delta Ts13 min read

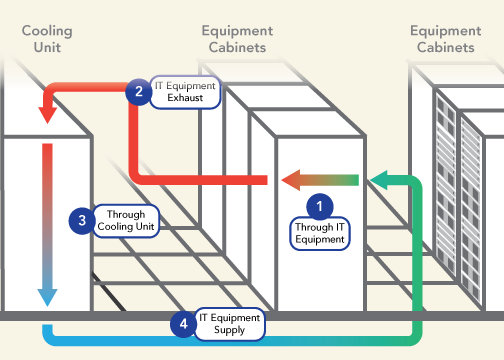
Data center airflow management effectiveness is most directly indicated by two temperature differential (ΔT) measurements: the temperature rise of air through IT equipment and the difference between the cooling equipment supply temperature and the return intake temperature. As I discussed in my previous posting, the goal is for these two ΔT’s to be the same. That is to say, we deliver a certain temperature of air into the data center and it removes a certain amount of heat from our IT equipment and that increase is what we see back at our cooling equipment return air intake. For example, if our cooling equipment is supplying 60˚F air into the data center and air passing through our IT equipment picks up and removes 20˚F of waste heat, then we should expect to see 80˚F air at our cooling equipment return air intakes.
Such perfect conditions allow us maximum freedom to manipulate temperatures to maximize chiller efficiency and exploit free cooling, which I will discuss in more detail in the final piece of this four-part series. Meanwhile, what do we actually see in practice? Most often we see relatively significant differences between these two ΔT’s and when we do see encouragingly close numbers, those invariably turn out to be false positives – that is to say, we can accidentally see an alignment with these ΔT’s because bypass airflow and re-circulation are equally bad. More on that later. The bottom line is that the ΔT across our cooling equipment (ΔT#3 in Figure 1) is the primary indicator of data center airflow management health to the degree it approximates ΔT#1; however, variations in the secondary Delta T’s (IT exhaust, #2 and supply, #4) arise from flaws in our airflow management and prevent us from achieving our goal or, more insidiously, mask those flaws in our airflow management practices.
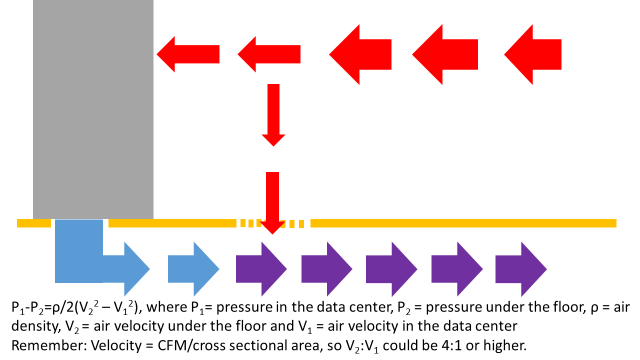
It is actually somewhat surprising that the ΔT between the cooling unit supply output and the server inlet is not on many radars. After all, if you have 55˚F being supplied, which is fairly typical, (73˚F return set point with a typical 18˚F supply differential) that is 9.4˚F below the recommended minimum temperature for data processing equipment per the ASHRAE environmental guidelines. That low temperature, however, is not a problem because by the time it reaches the IT equipment it is typically going to be randomly distributed somewhere between 65˚F up to over 80˚F. What happens? Sometimes that supply air can warm up even before it enters the room from under the floor. For example, perforated floor tiles located too close to CRAHs can actually draw warm air into the underfloor space by virtue of low pressure created by high-velocity supply air – the well-known Venturi effect.
That path for heating the underfloor air does not have to depend on the air velocity close to cooling units. Underfloor obstructions can create vortices which can result in low-pressure pockets which can pull air down from the room into the underfloor space, mixing with the supply air and thereby increasing the temperature before it is delivered through perforated tiles into the data center. Then, once the supply air enters the computer room, it is still subject to conditions which can further increase the temperature. If there are openings in the server racks, either open rack mount spaces or unsealed areas around the perimeter of the equipment mounting area, some of the server waste air can leak back into the cold aisle and affect the temperature of the supply air.
Because of this contamination, we frequently see temperatures increase higher in the rack. In addition to hot air re-circulation within the rack, there are various causes for re-circulation at the room level. For example, low-pressure zones under the floor may not deliver an adequate flow rate for supply air, or, as noted above, may actually pull in air from the room rather than push out air into the room. Such low-pressure zones could be caused by obstacles to flow or perimeter cooling units being located at right angles to each other on adjacent walls. If pockets of the data center are not being adequately served with cool air and there is inadequate or nonexistent containment, the IT equipment is still going to have those fans humming and pull air from somewhere. CFD analyses or sensor surveys reveal in these situations servers will pull warm return air from over the tops of cabinets or around the ends of cabinet rows. The ultimate result of increasing the supply temperature along the vertical plane in front of the server rack is that the server rack inlet to outlet ΔT can be significantly higher than the equipment ΔT. For example, the temperature rise through all the servers might be 20˚F, but the inlet temperature at the bottom of the rack might be 60˚ and the outlet at the top, rear of the cabinet might be 95˚F, for a rack ΔT of 35˚, or 175% of the actual IT load.
It is not uncommon to hear data center professionals tout the value of driving up the ΔT as high as possible. When we hear such propositions, they are usually talking about the ΔT across the cooling equipment because of the resultant increase in perimeter precision CRAH efficiency and the increase in access to partial economization in most free cooling applications. However, when that ΔT has been artificially inflated to anywhere from 150% to well over 200% of the IT ΔT due to re-circulation of poorly managed waste air, the expense supporting that higher ΔT with lower set points reverses any advantages, real or imagined, from the unrealistically high ΔT.
Conversely, in most data centers today the ΔT from the servers back to the cooling source is negative; that is to say, the temperature of the return air tends to decrease after it is exhausted from the IT equipment on its return path to be re-cooled. The dynamic in this situation is very straightforward: excess cooling air is bypassing the data center heat load and returning to the cooling units, mixing with the return waste air and reducing its temperature along the way. There can be several causes of such bypass airflow. Improperly located perforated floor tiles (the boss gets too hot in the hot aisle) can cause cool air to bypass heat load. Large underfloor pressure differentials can result in high-pressure zones that pump volumes of air into a cold aisle or portion of cold aisles in excess of the demand indicated by the intake fans of the associated IT equipment. Unsealed cable access holes in tiles located toward the rear of server racks will result in cold air directly joining the exhaust air inside the back of the server rack. This source of bypass airflow can be a little tricky when you are troubleshooting cooling efficiency issues by monitoring ΔT’s because it can mask the true IT equipment ΔT. The simple rule of thumb here is if there are unsealed floor cut-outs in the rear of server racks, that will result in bypass and those holes should be plugged up before any other monitoring or corrective action steps are taken.
I will discuss the economic ramifications of the two primary ΔT’s and two secondary ΔT’s in more detail in the final piece of this series. For the time being, suffice to say that when ΔT’s at the cooling equipment is lower than ΔT’s across IT equipment, and the IT equipment is being adequately cooled, by definition we are producing bypass airflow and we are investing in unnecessary cooling equipment fan energy. Unfortunately, it is quite possible to have a pretty close match between IT equipment ΔT and cooling equipment ΔT and still be (not) managing a wasteful train wreck of a space. For example, if we have a 200% artificially increased ΔT through the racks due to rampant re-circulation of hot waste air while simultaneously producing 200% bypass airflow by wasted cooling unit fan energy, it is conceivable that these opposing elements of wastefulness will nullify each other at the cooling equipment return air intake. Picking up the previously discussed example, we could have a 20˚F ΔT through our IT equipment but a 35˚F ΔT between the bottom front of the rack to the top rear of the rack. However, because of a large volume of wasteful bypass airflow, that bypass could mix with the 95˚F return air and drop it back down to 80˚F by the time it hits the cooling equipment return air intakes. If we were relying exclusively on the cooling unit ΔT as our metric for data center health, we would be seriously risking dislocated shoulders from patting ourselves on the back, when, in fact, we’re lucky we still have a job. That is why we want to pay attention to these secondary ΔT’s.

Ian Seaton
Data Center Consultant
Let's keep in touch!
Airflow Management Awareness Month
Free Informative webinars every Tuesday in June.
0 Comments
Trackbacks/Pingbacks