The Four Data Center Delta Ts: Dollars and Sense17 min read

Data center health is frequently discussed in terms of PUE, but a PUE check-up can be sort of like checking a corpse for a pulse, particularly when we consider that an honest and educated practitioner means EUE (Energy Usage Effectiveness) when they say PUE. That is to say; we like to have a year’s worth of energy use data to account for seasonal variations in workload, economizer access and building shell load. Of course, by the time we have acquired enough data to claim a meaningful assessment, the corpse may be a tad cold. This is why I have been making the point in my previous three pieces on the value of tracking and fine-tuning on the fly these four data center temperature differentials (ΔTs) illustrated in Figure 1. The point I have made is we want to get the temperature differential across our cooling equipment (ΔT#3) to match as closely as possible the temperature rise of air through our ICT equipment (ΔT#1), and we accomplish this by minimizing changes in our return air temperature (ΔT#2) and our supply temperature (ΔT#4). These metrics are the foundation for establishing and maintaining good airflow management and thereby ultimately deriving resultant PUE/EUE optimization.

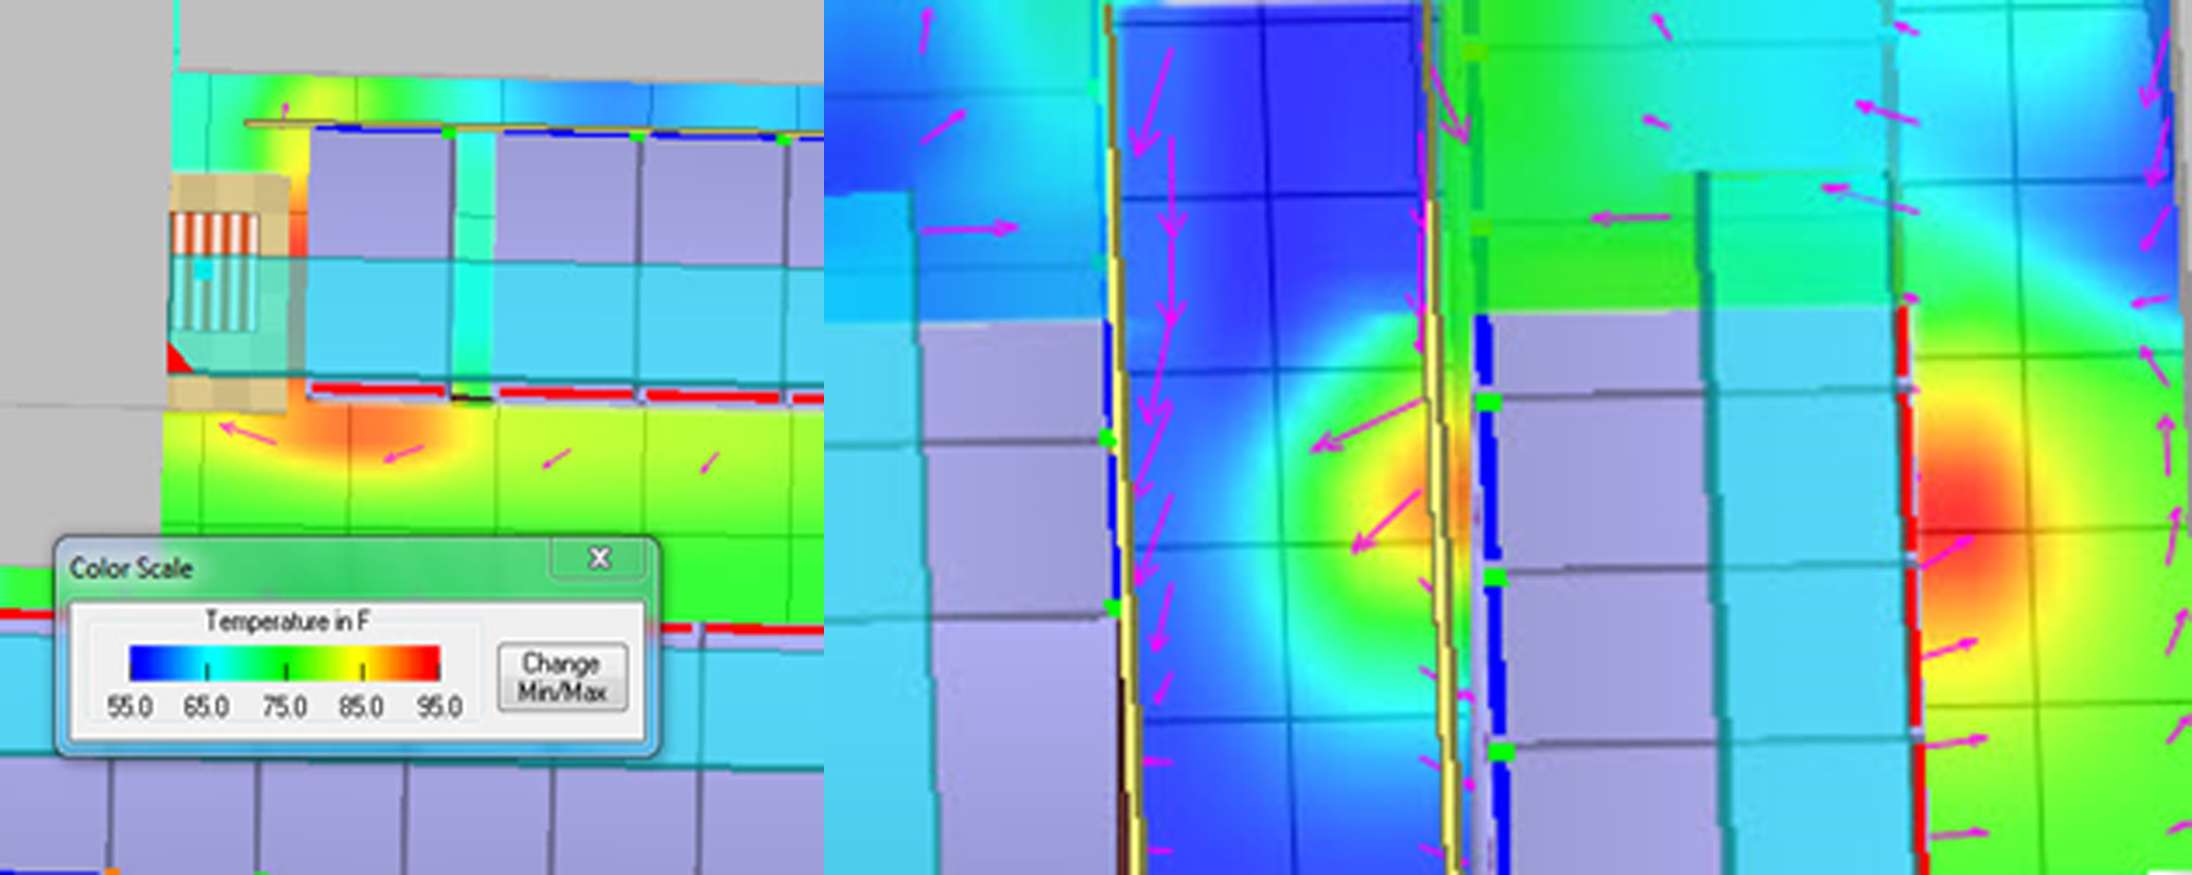
In most situations, the optimum efficiency in the data center will be achieved when there is minimal difference between the supply air temperature and the server inlet temperature, minimal difference between the IT equipment ΔT and the cooling coil ΔT, and the supply temperature can, as a result, be elevated to a temperature approximating the maximum specified IT equipment intake air temperature. Monitoring all four ΔTs can provide valuable assistance for dialing in the data center to meet this optimum performance level. Any server inlet temperature that is more than 2˚F above the supply temperature being produced by cooling units means that there is hot air re-circulation caused by open pathways between hot and cold aisle, inside or around the server racks, or there is an inadequate flow zone that may require CFD analysis to determine any source of pressure variations under the floor. Re-circulation is relatively easy to isolate: Obviously, thermal alarms at the IT equipment are a reliable indicator. Also, any temperature measurement in a “cold aisle” that is more than 2˚F higher than the supply air temperature exiting our cooling equipment is going to be indicative of re-circulation. The Upsite Technologies 4R model is a reasonable guide for troubleshooting hot air recirculation. The first R is the raised floor, so we check the temperature of the air coming through the floor grates. A high reading here means we either have open tiles too close to perimeter cooling equipment or we have underfloor obstacles producing vortices and resultant low-pressure areas under the floor. Next, we check the racks for full rack mount unit spaces and any peripheral re-circulation paths. (See Figure 2) Next, we check the rows of racks for missing racks or openings in the row. (See Figure 3) If our IT load density is over 2.5-3 kW per rack, we should check ends of rows and over the tops of rows (See Figure 4) and consider at least some elements of containment. Finally, at the room level, we are concerned with the proper placement of cooling sources in relation to the orientation of rows of racks and voids in return plenum spaces.
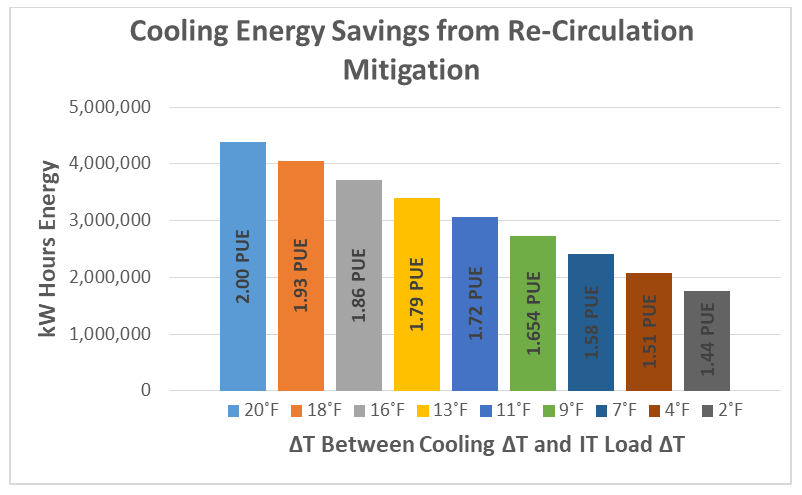
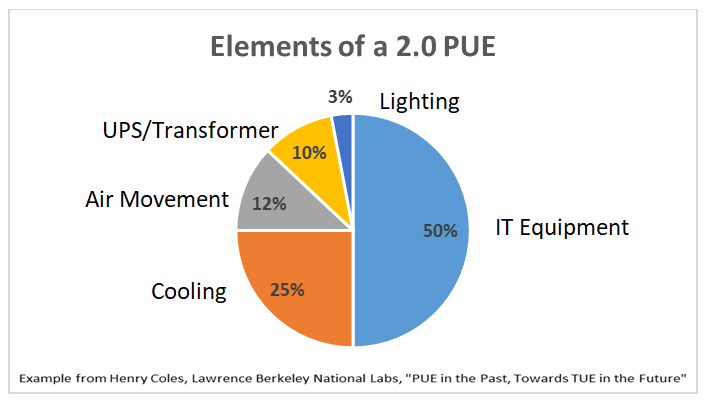
Historically, hot air re-circulation has been the bane of data center operators because it is the primary source of hot spots, overheating equipment and warning alarms in the middle of the night. Often, once the hot spots are below whatever we have determined our warning threshold is, we feel the problem is solved and we move on to the next crisis. Unfortunately, this decision leaves us with a bleeding energy budget with plenty of room for improvement. It costs us significantly more to produce 60˚F chilled air to assure all our equipment sees intake air temperatures below 80.6˚F than it does to produce 77˚F air to assure all our equipment sees intake air temperatures below 80.6˚F. Figure 5 presents an example data center’s energy costs for cooling at several air temperature differences between the IT ΔT and the cooling equipment ΔT, which is our metric for hot air re-circulation. The smaller that temperature differential is, the higher we can operate our supply temperature and harvest chiller efficiency savings. There are many variables which will drive these energy costs, but the trajectory is representative of a reasonable expectation. In this particular case, I used a Lawrence Berkeley National Labs breakdown of a 2.0 PUE data center (Figure 6) as a baseline and dollarized those elements for one Megawatt (1MW) data center. I used 1.44 as my target PUE for a data center with nominally no hot air re-circulation based on the experience of successfully achieving Mechanical Load Components (MCL, or cooling-only portion of PUE) in the 1.20’s without the benefit of free cooling and then just applying kW per ton on a straight slope between the two extremes.
If the return air intake of the cooling units is more than 2˚F lower than the exhaust temperature from the IT equipment, then there is a bypass airflow problem. Areas to check include improperly placed floor tiles, unsealed floor openings, or simply excess airflow being delivered into the room. Bypass can be a little more difficult to isolate than re-circulation. Where containment is deployed, bypass can be detected by pressure sensor differences between the hot and cold sides of the containment or by rack-mount devices that mechanically capture any air flow through the rack as either re-circulation or bypass. The primary metric, however, remains the difference between the rack exhaust temperature and the cooling unit return intake temperature. The bigger that drop is, the more bypass airflow is being pumped through the data center. The only way to reduce bypass airflow at the room level is to reduce the cooling flowrate. Historically, the biggest culprit has been unsealed floor tile cut-outs for cable access in the bottom-rear of server cabinets. The second most significant historical culprit is the assertion that no one ever got fired for keeping the data center cold (too cold = cold enough), though we have seen a little movement on that since energy utility bills have soared into the millions of dollars. Using the metric of the temperature differential between server rack exhaust and cooling unit return in-take to drive behavior on the floor and speeds on our variable speed cooling equipment fans can help meet PUE and energy use goals, as indicated in Figure 7.
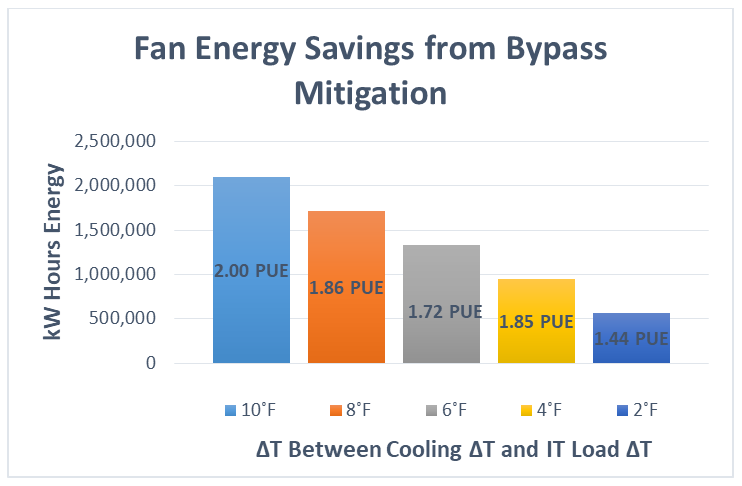
My methodology for assessing bypass airflow control energy savings potential opportunities was the same as I used for the re-circulation calculations for the baseline and ideal condition target, though in this case I used fan energy required to produce the amount of bypass, based on 15,000 CFM maximum air delivery per unit with 12 hp fan motors per unit and utilizing fan affinity laws for energy calculations based on N+2 redundancy at each airflow volume capacity level.
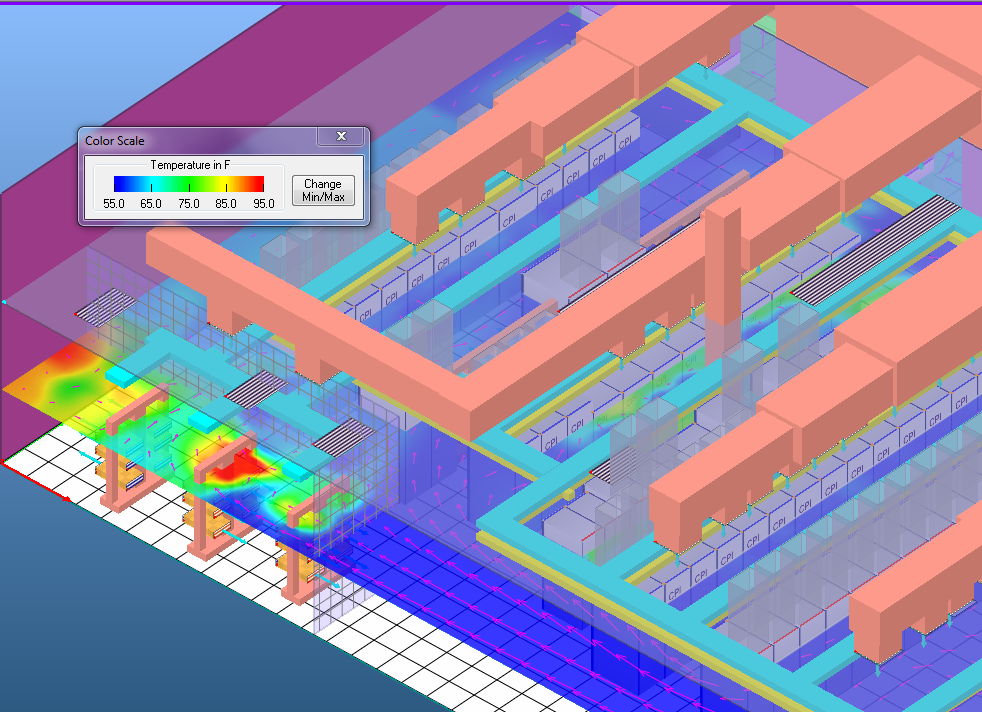
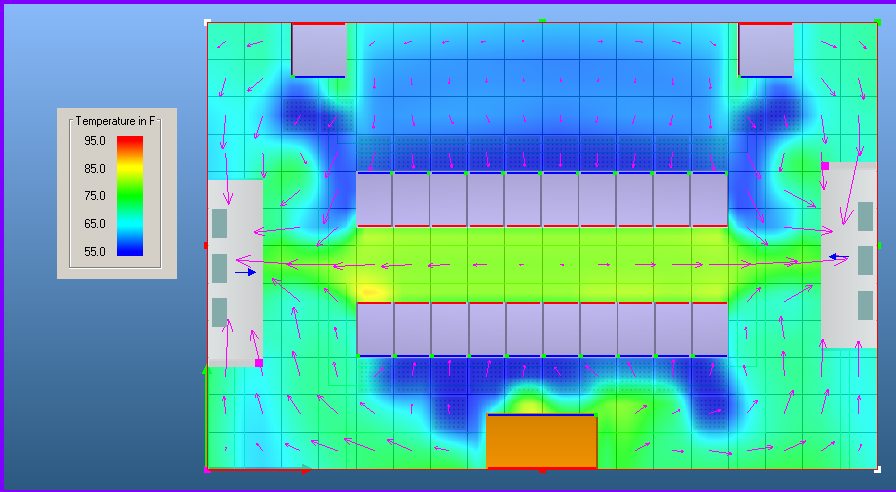
Unfortunately, nothing I have written up to this point in this piece is particularly accurate. Sure – re-circulation is bad and ΔT4 will tell us if we have it and how bad it is, and bypass airflow is wasteful, and ΔT2 will tell us if we have it and how bad it is. However, the implication that we could look at these two phenomena in isolation is misleading – not intentional, but misleading nevertheless. The data represented in Figure 5 and Figure 7 imply that, respectively, we can achieve the represented trajectory of PUE improvement resulting from re-circulation mitigation based on the assumption that there is no bypass. Likewise, we can achieve the represented trajectory of PUE improvement through eliminating bypass airflow based on the assumption there is no recirculation. Those assumptions might be to some degree defensible in data centers with a fluid dynamics profile like that in Figure 8.
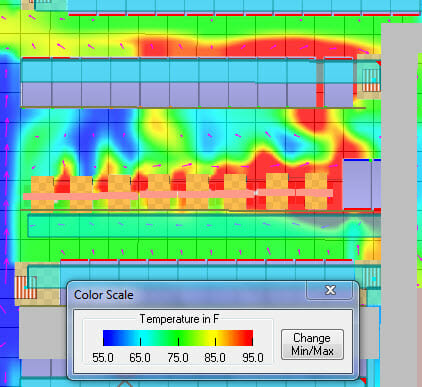
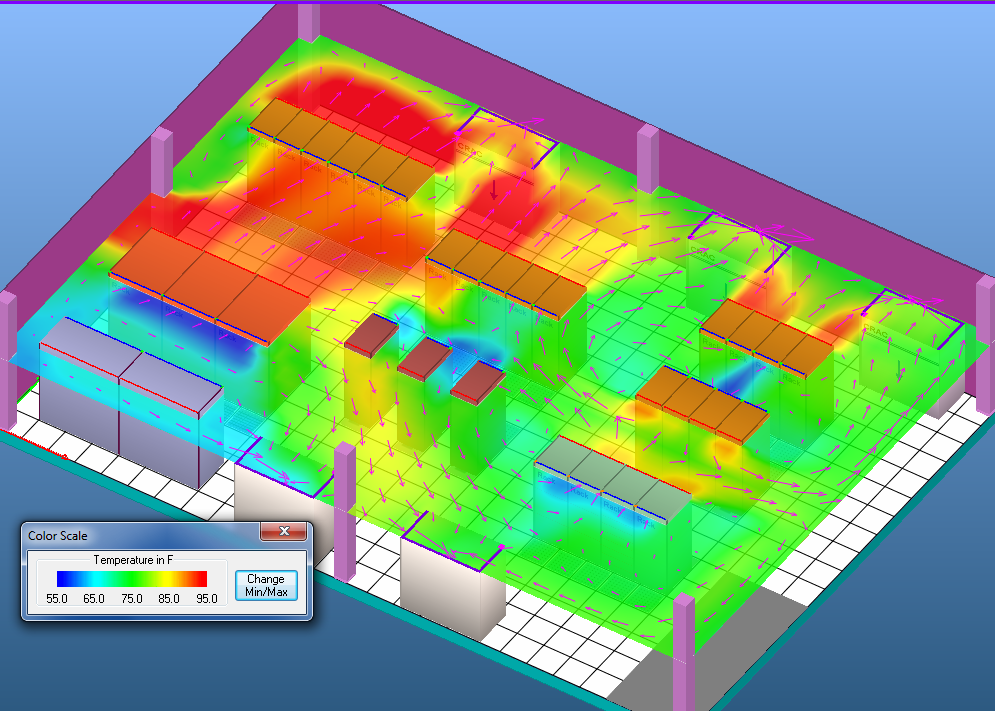
However, in most cases, we are going to see spaces that look a little more like Figure 9, where we have bypass and re-circulation going on simultaneously. Sometimes this simultaneity is purely coincidental and can be happening in different parts of the room independent of each other and sometimes they can be happening right on top of each other. For example, hot spots are often attacked by lowering the set point and ramping up the airflow. One of the unintended consequences of such responses is that there can be lower density or better-managed spots in the room where the return air may come back at a lower temperature than the set point, so the fans keep blowing the air around without any cooling. This re-circulated un-cooled air could be bypass. The air that returned below-set point is bypass. And don’t rule out the possibility that this uncooled circulated supply air may end up producing hot spots as a result of lowering set points and increasing airflow.
For these reasons, monitoring ΔTs and responding to unsatisfactory measurements with corrective actions can never be done in isolation. We may not have hot spots or negative re-circulation indicators because they are being compensated for by bypass airflow. Likewise, we may have hot spots or re-circulation indicators exactly because we have bypass airflow that is just missing our heat loads.
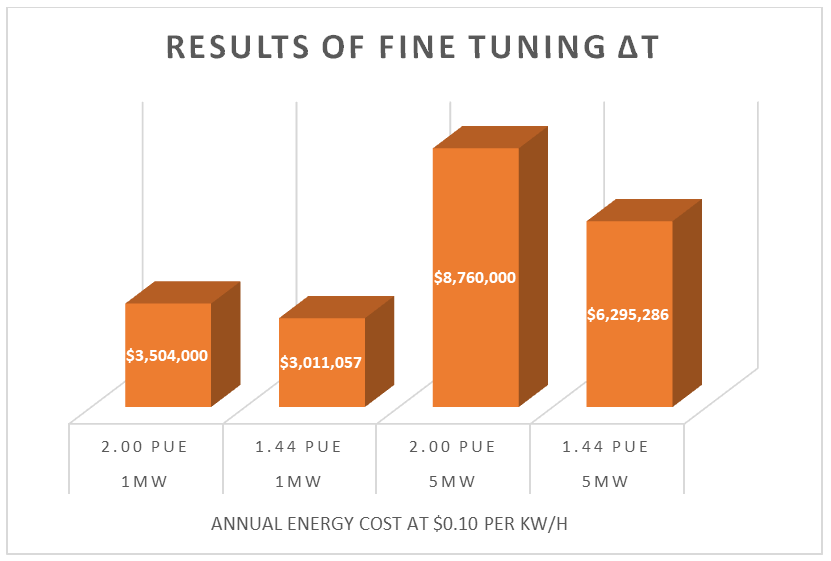
Without the benefit of any free cooling, merely by plugging holes and modulating airflow production to meet actual demand, reasonably low PUE (EUE) levels are achievable. The data in Figure 10 illustrates total operational dollars for a one-megawatt data center and a five-megawatt data center, with the before condition representing a 20˚F ΔT between average rack server exhaust temperatures and cooling unit return intake temperatures and a 10˚F ΔT between cooling unit supply output and average server inlet temperature. Differences reflect chiller efficiencies at higher temperatures and fan efficiencies at lower volume and speed, plus some minor differences for UPS losses since this particular model assumes cooling unit fans are on UPS. The after condition represents a 2˚F ΔT difference for both ΔT2 and ΔT4 (Figure 1). These ΔT changes can produce a $500,000 annual operations savings for a 1MW facility and almost $2.5 million for a 5MW facility at $0.10 per kW/H energy cost. Those are not insignificant numbers for many of us. For those of us, however, who may find those yawn-worthy, perhaps equating those savings to the profit, respectively, on a $5 million purchase order or a $25 million purchase order and the associated commission might make them a little more meaningful. Data center delta T can deliver the dollars.

Ian Seaton
Data Center Consultant
Let's keep in touch!
Airflow Management Awareness Month
Free Informative webinars every Tuesday in June.
0 Comments