Data Center Airflow Management at 100˚F21 min read

Is the time right for the 100 degree Fahrenheit data center? It sure seems like it should be with the ASHRAE TC9.9 guidelines allowing server inlet temperatures up to 95˚F for Class A2 servers, 104˚F for Class A3 servers and 113˚F for Class A4 servers. When we finally decide to take advantage of these expanded environmental envelopes, what might we expect to see in our data centers? For obvious starters, they will be hot; but perhaps not quite as hot as we think. They’re going to be noisy, but again, not likely to be as noisy as we have been led to believe. We will see lower PUE’s, but those PUE’s may be lying to us, just a little. Finally, we will see that our need for excellent airflow management is even more critical.
Of course a 100˚F data center is going to be hot, but let’s take a moment to be sure we know what that means. First, if we are in a cold aisle containment data center and we are calling it a 100˚ data center because that’s the ambient temperature in the data center outside our containment aisles, we are like the guy at the water cooler talking about his wife’s Avon commemorative bottle collection and everyone else is talking about their “PORTFOLIOS” – we may be in the wrong conversation. This 100˚ data center, assuming decent airflow management, may still be living inside the ASHRAE recommended envelope and not exploiting any of the benefits of the allowable envelopes.
On the other hand, if we are taking advantage of higher allowable server inlet temperatures to increase our access to free cooling and also increase our chiller efficiency, then we may truly want to encourage shorts, sandals and tank tops for our technicians; however, this attire may not be comfortable for as many days as we might initially think. For example, Figure 1 below gives us a lumpy bell curve for hours at different temperatures in Las Vegas, where we have some well-known data centers and know that it can get pretty warm. However, the data tells us that the median temperature is 69˚F and the mean temperature is 69.8˚F. Figure 2 shows the same data organized into 10˚F buckets to smooth out some of the outlier data points to clearly show a significant portion of that bell is in the long pants and socks territory.
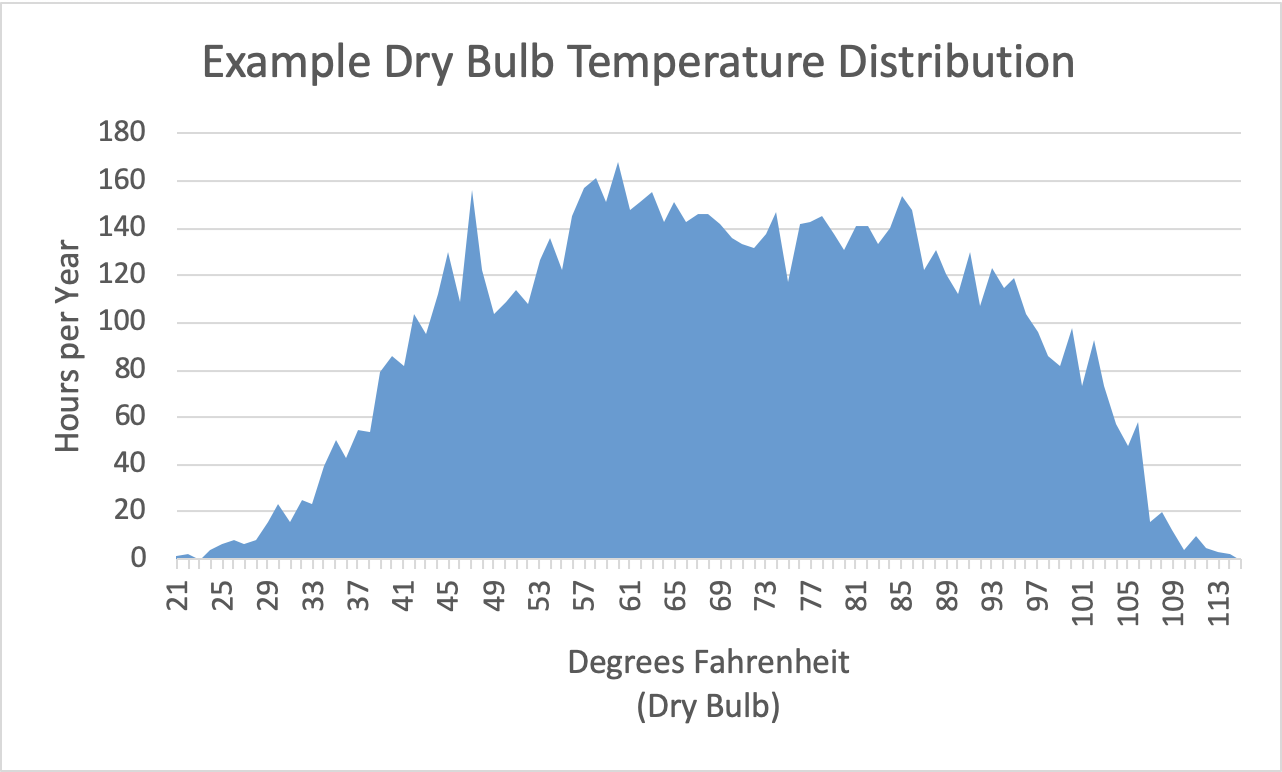
Figure 1: Annual Hours at Different Dry Bulb Temperatures for Las Vegas (2008)
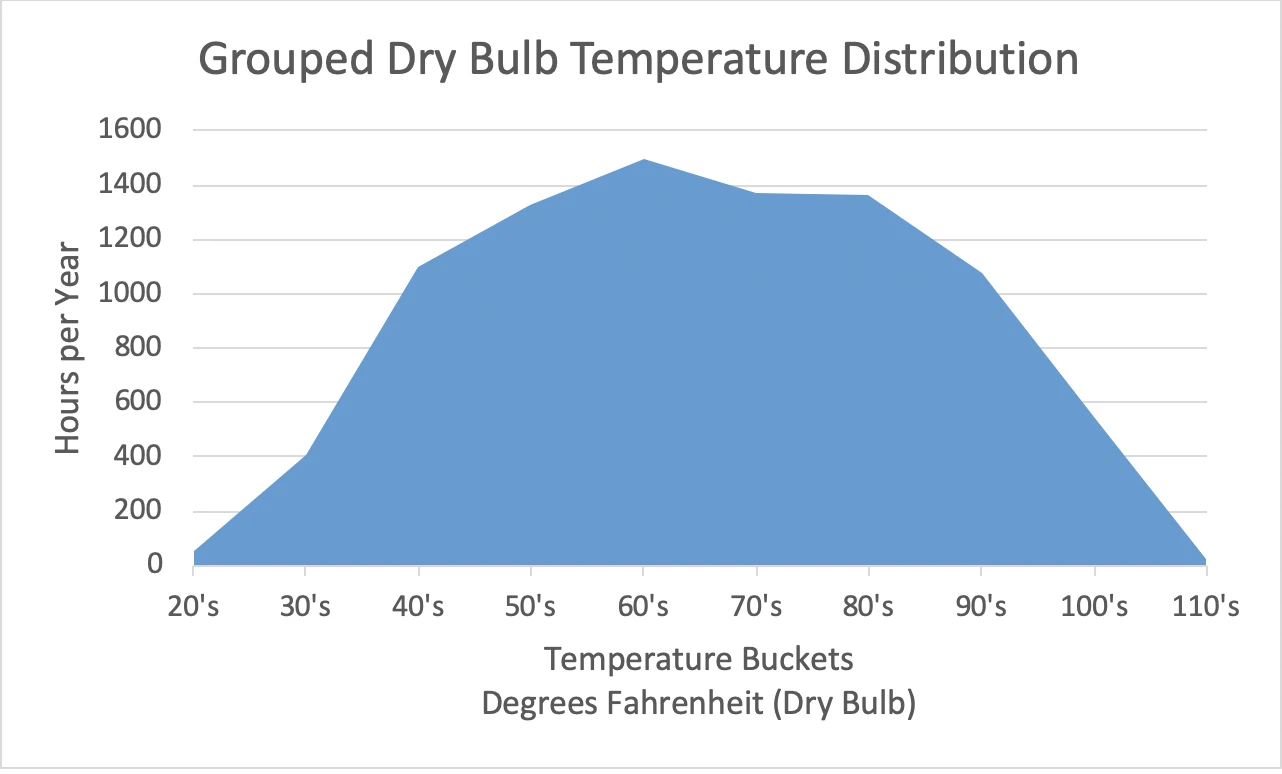
Figure 2: Las Vegas Dry Bulb Temperatures Grouped into 10˚F Buckets
While ambient dry bulb temperatures will be meaningful for predicting the proportion of the year we gain access to air-side economization, wet bulb temperatures will provide our gateway to water-side economization, evaporative cooling and indirect evaporative cooling. Figure 3 illustrates the granular detail that tells us in Las Vegas we have a 49.5˚F median wet bulb temperature and a 49.3˚F mean wet bulb temperature for the example year. As with dry bulb temperatures, the large portion of wet bulb temperatures are going to be much more comfortable than our recommended uniform might require.
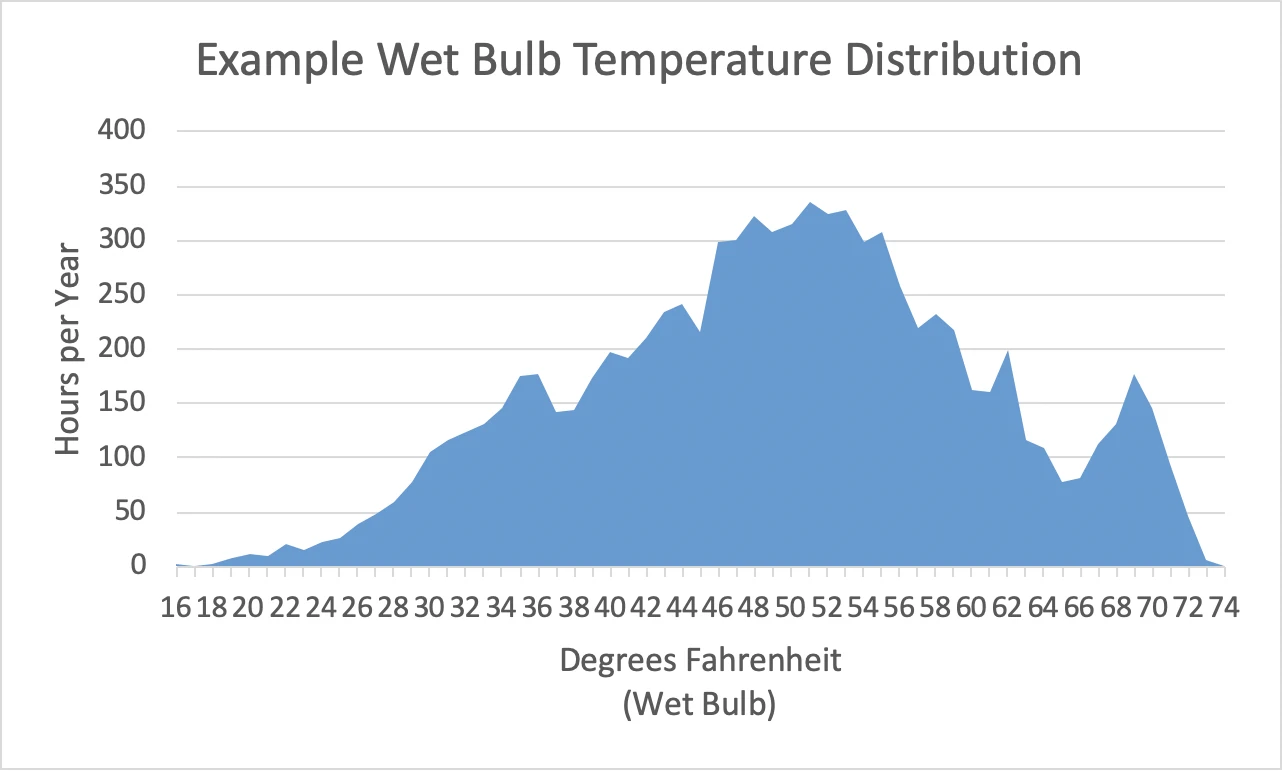
Figure 3: Annual Hours at Different Wet Bulb Temperatures for Las Vegas (2008)
The grouped data points in Figure 4 give us a little clearer indication of what proportion of the year our data center will see different ambient wet bulb temperatures.
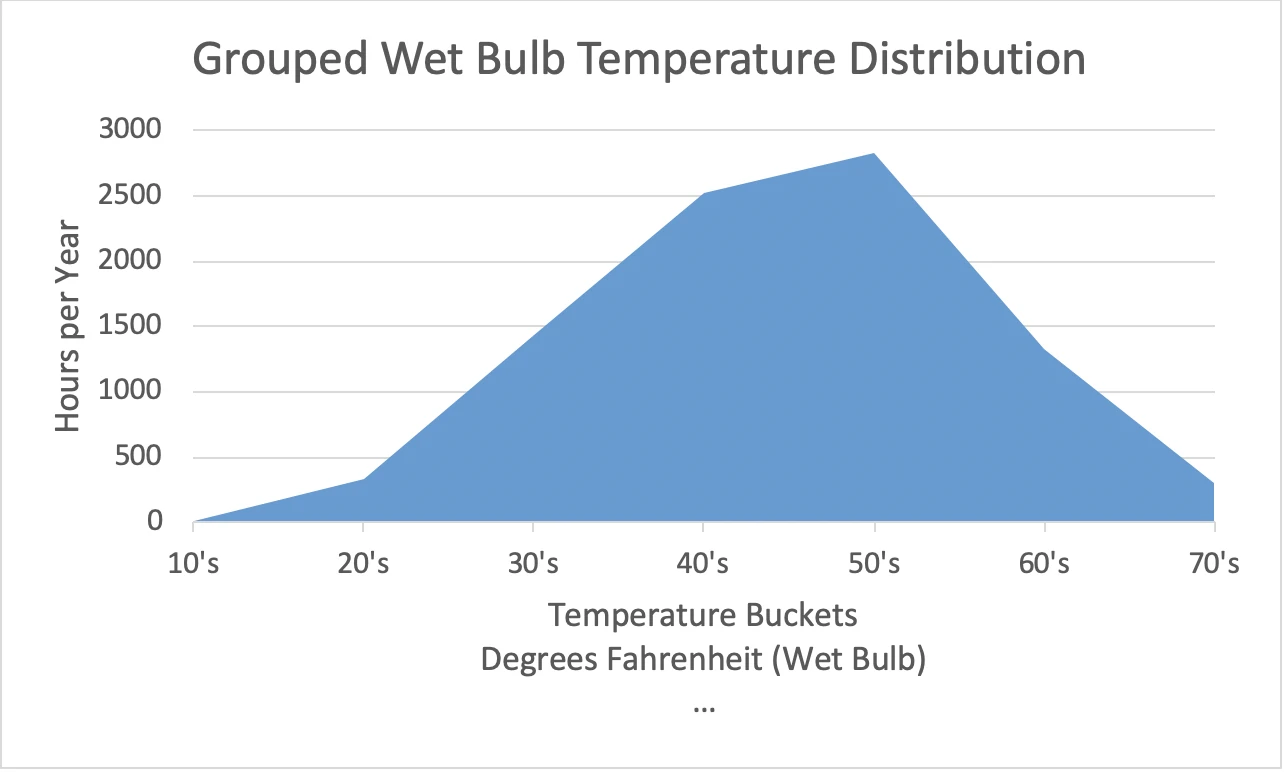
Figure 4: Las Vegas Wet Bulb Temperatures Grouped into 10˚F Bulb Buckets
What this temperature data for our sample geography tells us is that, yes, our data centers will get hot, but that our time of exposure to that heat might be a lot less than we anticipated. For example, Table 1 shows us how many “hot” hours we might actually see inside the data center in four sample locations. For sake of argument, we are going to call anything over 90˚F hot. Where I live here in central Texas, we call that springtime conditions, but I know I have readers out on the left coast who will consider that hot. We are going to allow our Class A2 servers to see 95˚F maximum inlet temperature and in our Class A3 data center we will allow our servers to see a maximum 104˚F inlet temperature. We will establish our maximum supply air temperature 2˚F below our maximum allowable inlet temperature: 93˚F in the Class A2 data center and 103˚F in the Cass A3 data center. When the temperature gets above those maximum supply set points, our AC will kick in. Therefore, our hot temperature periods will reside between 90˚F and the respective AC set points. Under these conditions, Table 1 shows us how many hot hours we will see in data centers in each of our sample locations, the percentage of the year those hours represent, and the per cent of the year when AC will be required to keep the air below the set point.
| Class A2 | Class A3 | ||||
| Hot Hours | Annual % | AC % | Hot Hours | Annual % | AC % |
Denver | 111 | 1.3% | 1.3% | 226 | 2.6% | 0.0% |
Houston | 265 | 3.0% | 9.1% | 342 | 3.9% | 8.2% |
Las Vegas | 472 | 5.4% | 13.4% | 1438 | 16.4% | 3.5% |
Phoenix | 694 | 7.9% | 19.6% | 1817 | 20.7% | 6.8% |
Table 1: Hot Hours in Data Centers with Airside Economization
Likewise, we can look at wet bulb-based cooling systems and how many resultant hot hours we might expect in our data centers operating to the limits of both A2 servers and A3 servers. For this analysis, I am using indirect evaporative cooling technology with a 7˚F approach temperature between the ambient wet bulb temperature and the supply air dry bulb temperature, plus an additional 2˚F headroom between the supply temperature set point and the maximum allowable server inlet temperature for each server class. Table 2 shows us how many hot hours and AC hours would be required in each of our four sample locations. That, by the way, falls into my definition of “interesting.”

Table 2: Hot Hours in Data Centers with Indirect Evaporative Cooling
One of the well-known side effects of operating our data centers at higher temperatures is that our server fans are going to ramp up, resulting in increased noise level. Table 3 below offers comparisons of four different sets of data center noise assumptions. The 70 dBA and 80 dBA baselines are from multiple sources as the typical range for noise levels in data centers, which will include all the IT equipment, as well as electrical and mechanical equipment. The 75.5 dBA baseline is the average from all the hot and cold aisle measurements in the study reported on by Miljkovic (“Noise Within a Data Center,” Dubravko Miljković, MIPROS 2016 Conference Proceedings, Croatia, May 2016, page 1354) and the 84 dBA baseline is from an ASHRAE assumption(“Expected Increase in A-Weighted Sound Power Level”, Thermal Guidelines for Data Processing Environments, 4th edition, ASHRAE TC9.9, page 27) that may be somewhat alarmist or perhaps based on projected densities not yet realized in most of the data center marketplace. (I invite the intellectually curious reader to see my Airflow Management Considerations for a New Data Center: Part 7: Server Acoustical Noise versus Inlet Temperature blog for the math and logic behind my assertion that the ASHRAE decibel estimates are over-stated.) The left hand column under each of those four baseline scenarios shows the incremental increase in server fan noise at the different temperature increments for ASHRAE Class A3 servers and the right hand column under each of those scenarios shows those noise level predictions for ASHRAE Class A1 Servers.
Summary of Various Scenarios: Effect of Server Inlet Temperature on Data Center Noise | ||||||||
Inlet Temp | 70 dBA Baseline | 75.5 dBA Baseline | 80 dBA Baseline | 84 dBA Baseline | ||||
77˚F | 70 | 70 | 75.5 | 75.5 | 80 | 80 | 84 | 84 |
86˚F | 71.9 | 74.7 | 77.4 | 80.2 | 81.9 | 84.7 | 85.9 | 88.7 |
95˚F | 7.38 | 76.4 | 79.3 | 81.9 | 83.8 | 86.4 | 87.8 | 92.4 |
113˚F | 78.5 | 82.9 | 84.0 | 88.4 | 88.5 | 92.9 | 92.5 | 96.9 |
Table 3: Comparative Summary of Data Center Noise Conditions at Different Temperatures
To determine if these estimated incremental increases in sound power level are problematic, they need to be considered in terms of the total environment into which they are being introduced. The baselines could be adjusted up or down by the type of cooling deployed, location of deployment and level of concurrently running redundancy. Hearing protection programs are mandated beginning at exposure to 85 dBA and Table 4 shows maximum exposure time requirements and recommendations for different hazard levels. Prudence would suggest the efficacy of at least doing a noise level check in any data center. Moreover, the data reported on here clearly points to the need to involve an acoustics engineer for any plan to allow server inlet temperatures to creep up into the 95˚F range for the development of a monitoring and protection program, as well as developing mitigation architectural elements into the total space design for absorption and redirection strategies. Regardless, the data represented in Figures 1 and 3 indicate exposure periods to protected noise levels will occur but may only exceed the permissible time limits occasionally or never.
Level dBA | 85 | 88 | 90 | 92 | 94 | 95 | 100 | 105 | 110 | 115 |
OSHA Permissible | 16 |
| 8 |
|
| 4 | 2 | 1 | 0.5 | 0.25 |
NIOSH Recommended | 8 | 4 |
|
| 1 |
| 0.25 |
|
|
|
Table 4: Permissible Time Exposure Limits to Noise Levels in Hours
PUE improvements in hotter data centers are suspect because the server fan increases that produce the noise we discussed above also mean we are using more energy in a non-linear increase due to our fan affinity laws: that cube effect that gives us such great energy savings when we reduce our CRAH fans with good airflow management, turn around and bite us painfully when we move the needle in the other direction. However, since our server fan energy is included with the servers in the divisor of the PUE equation, our increased mechanical energy actually improves our PUE. While there has been some published research describing points at which PUE continues to be reduced while total data center energy increases, those studies included row-based DX cooling units or data centers without access to free cooling. In the final analysis, while increased server fan energy at higher inlet temperatures may reduce energy savings predicted by reduced PUE, those server fans will need to run for many more hours than indicated by the sample data in Figures 1 and 3 to actually reverse the total data center energy saving curve, when some form of free cooling is part of the overall calculation.
Finally, I have written about the importance of effective airflow management in a great number of these pieces over the years, so how important is it in a 100˚ data center? REALLY, REALLY important. If we are supplying 95˚F to our servers and they are producing a 25˚F ΔT, then we could conceivably be re-circulating 120˚F air to be re-ingested by our servers. ASHRAE has not yet articulated a specification or guideline for a Class A5 server. Furthermore, if we are going to produce bypass airflow in such a high temperature environment, we might make the boss a little more comfortable when he is strolling down a hot aisle, but we are going to undo all the economies we have gained by moving into the hot data center realm in the first place. When we get to this environment, having the elements in place for raised floor, rack, row and room airflow management will not suffice. We will want to regularly fine-tune and audit both hardware and discipline.
Airflow Management Awareness Month 2019

Ian Seaton
Data Center Consultant
Let's keep in touch!
Great article! Data center managers often make the mistake of simply adding more cooling capacity when their facility becomes too warm. While this will keep the data center at proper temperatures, it is not the correct way to handle this. With proper planning and monitoring, data center’s airflow helps keep all your equipment operating at the right temperatures. It also helps to keep cooling costs low, so your company isn’t wasting money on an inefficient plan.