Data Center Temperature Sensor Location18 min read

How does a cliché become a cliché? Mostly it has to do with being so obviously true that it goes without saying, but we all say it anyway, such as the old standby: You cannot manage what you do not measure. Back in August, I began a series of blogs on managing airflow management with a case study on how we did that in a data center lab and then followed that up with algorithms for optimizing coil efficiency and optimizing chiller efficiency1. Before continuing down that road of exploring the logic behind various data center environmental control systems and providing some suggestions for how to build and drive home-grown control mechanisms, I thought it might be a good idea to just stop the bus for a minute and do a brief refresh on temperature measurement. In the final analysis, it does not really matter if the objective is to minimize hot spots, maximize efficiency under the recommended 80.6˚F server inlet temperature ceiling or maximize free cooling within one of the allowable environmental envelopes, such as A3 servers at 104˚F or A4 Servers at 113˚F. In all cases, having some idea of actual temperatures can help free us from being perpetually in some kind of crisis reactive mode.
A reasonable starting place would be the ASHRAE TC9.9 recommendations on how to measure temperature, since their guidelines on recommended and allowable data center temperatures are ubiquitous and frequently better known than the actual server manufacturers’ specifications, even by the IT equipment sales personnel. ASHRAE defines three different models for locating temperature sensors: managing the space, setting up the space, and troubleshooting the space. The first two of these are relevant to the current discussion. For ongoing managing of the health of the data center, ASHRAE suggests taking temperature readings at every fourth rack position about five feet above the floor in the center of cold aisles.2 For set-up and installation verification, ASHRAE suggests measuring the temperature at the center of the air intakes of the top, middle, and bottom equipment mounted in a particular rack, approximately two inches in front of the server.3 My loyal readers may recall that the temperature measuring strategy I described back in August that we used in the CPI data center lab was a hybrid of these two recommendations, in that we permanently located temperature sensors in the cabinet front perforated doors, directly in front of the server air intakes at the top, center and bottom of end-of-row racks and center-of-row racks.
It is interesting to me that all the ASHRAE TC9.9 literature focuses on the importance of server inlet temperature yet they are suggesting the center of the cold aisle is a suitable proxy data point for server inlet temperatures. If we assume that we have in place highly effective airflow management from 100% blanking panel deployment to end of aisle containment and between aisle separation, then the ambient temperature in the center of a cold aisle should accurately represent what all our servers are ingesting. However, any departure from optimum airflow management, whether that be poor design intent or temporarily disabled separation during moves-adds-changes (MAC) or other maintenance activity, could result in that center of the cold aisle temperature becoming a very unreliable proxy for server inlet temperatures. For example, in Figure 1 below we can see an example of how there could be 25˚F difference between the temperature in the center of a cold aisle and the temperature of air a server at the top of the rack may be ingesting.
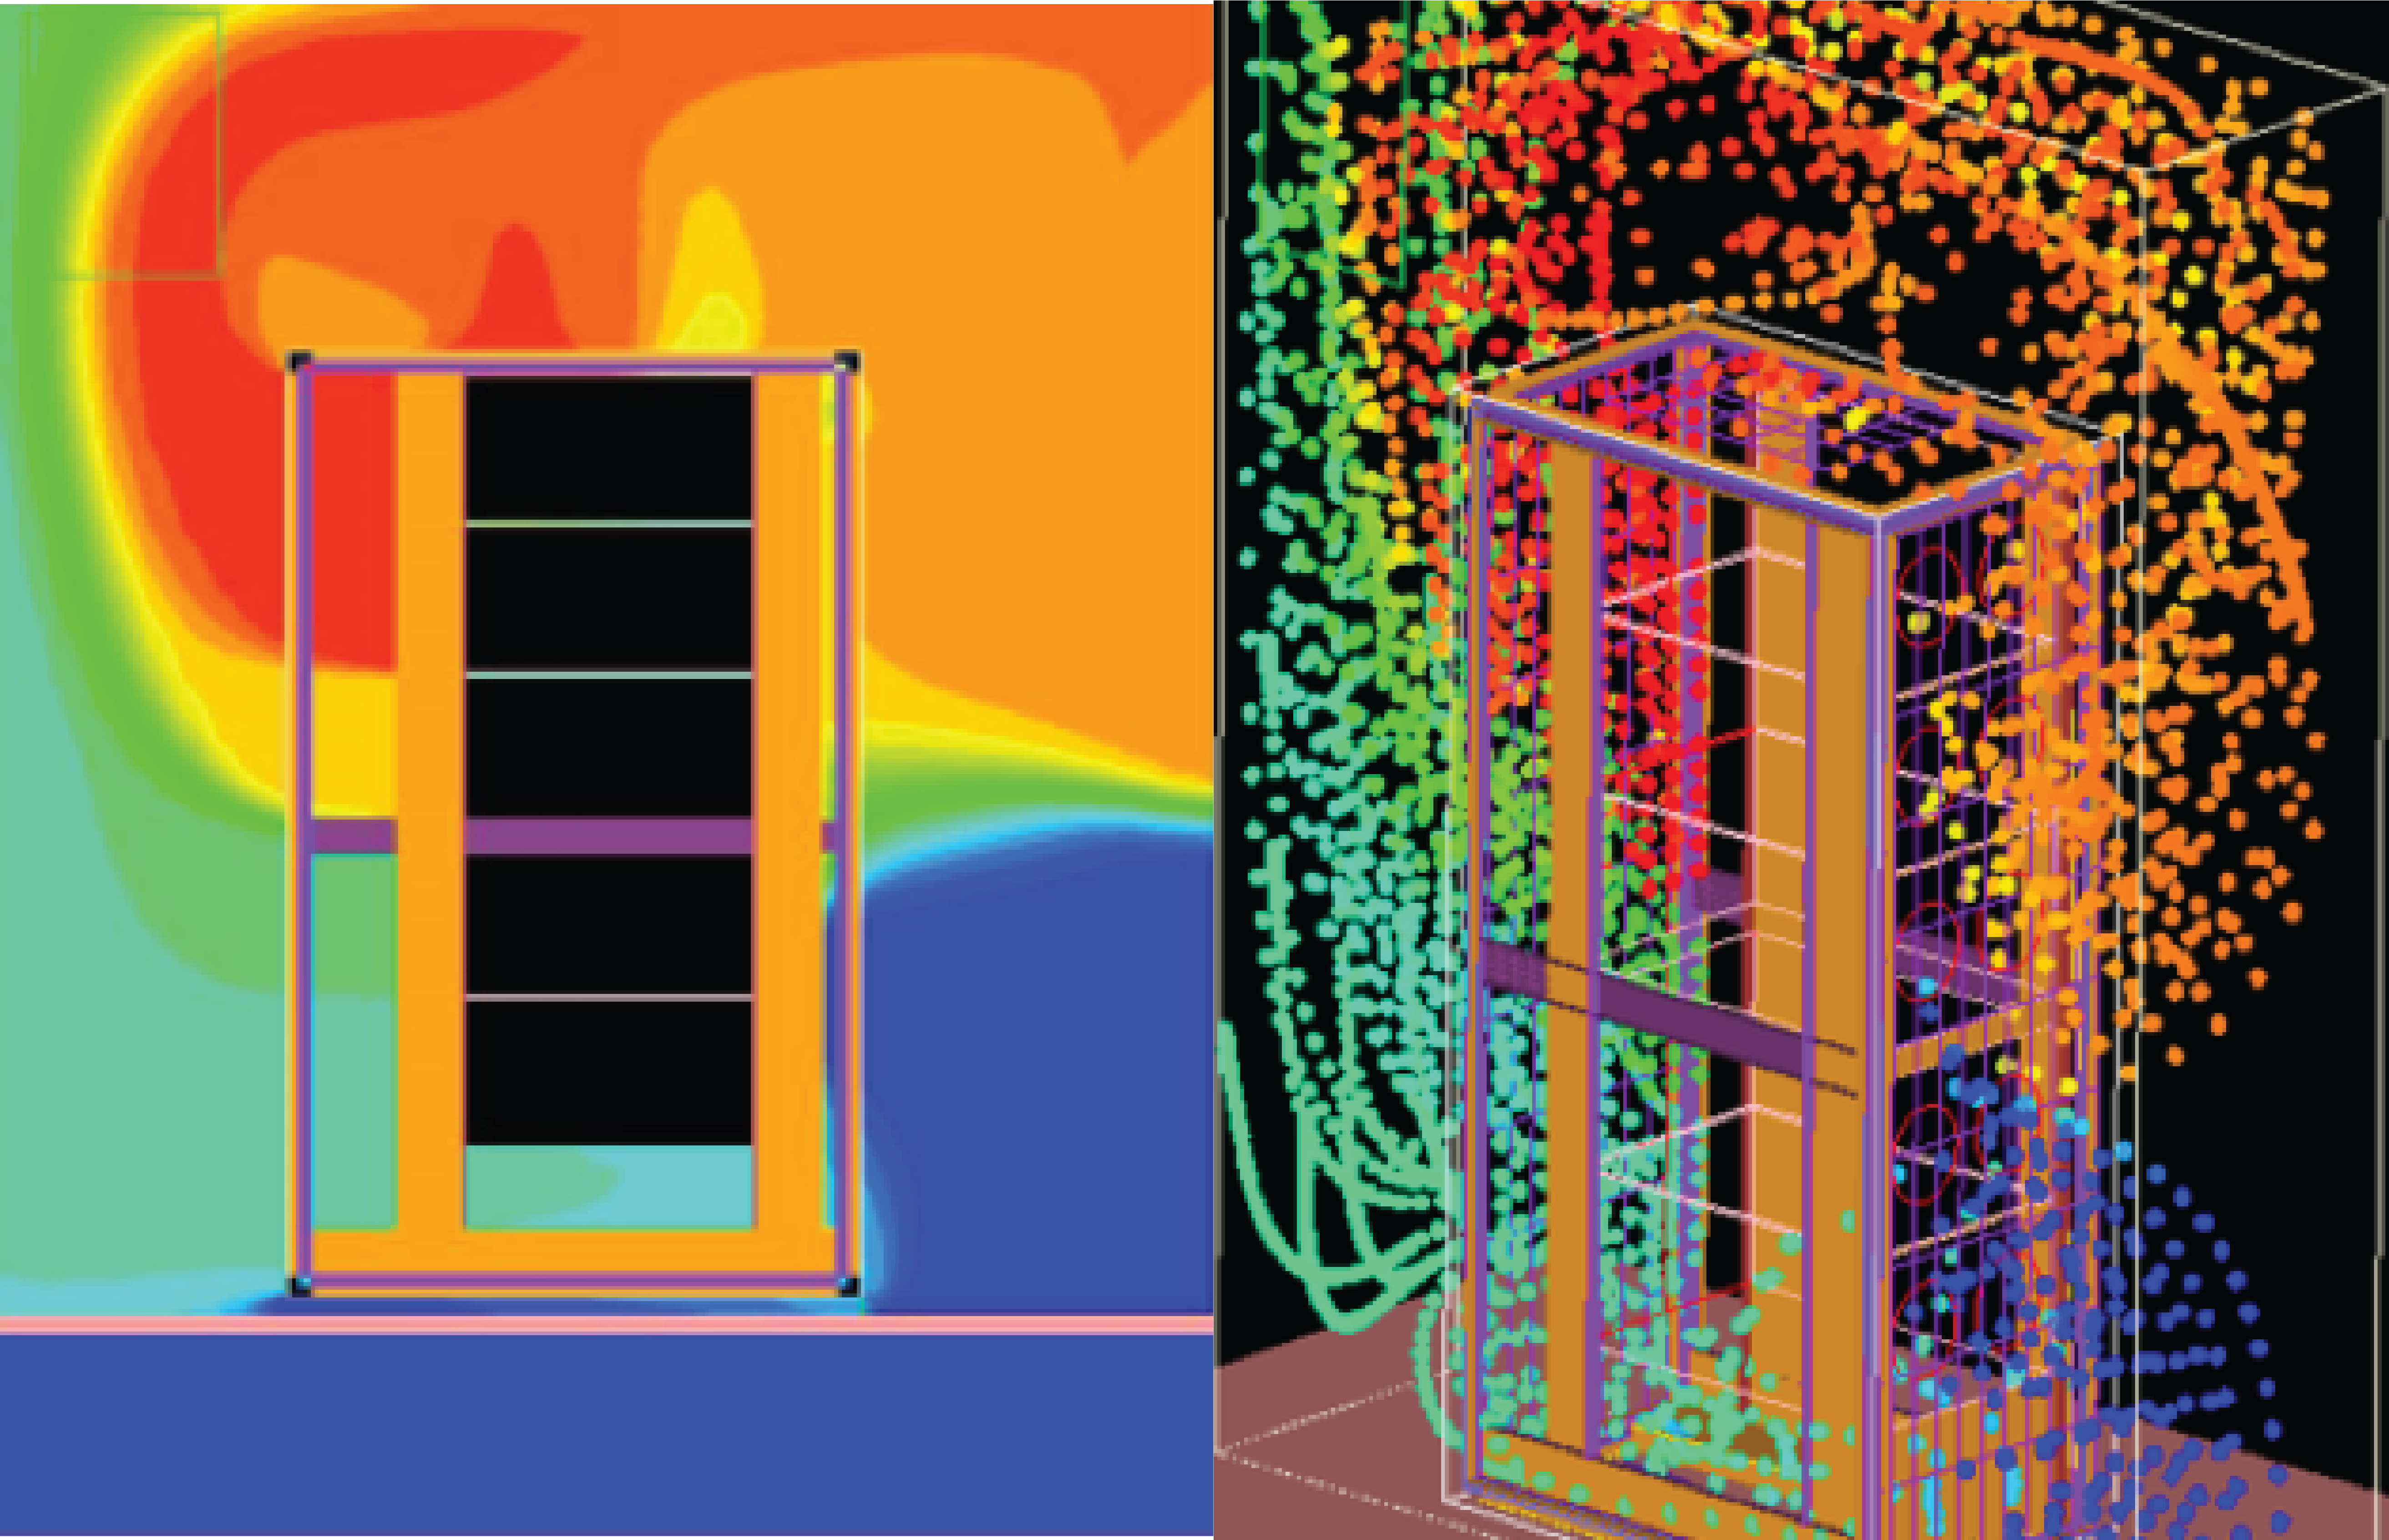
Figure 1: Top of Rack Hot Air Re-Circulation, Two Views
Another breakdown in airflow management occurs with non-compliant IT equipment that does not breathe from front-to-rear, or otherwise encourages reversed installation. The impact of deploying this equipment might not be revealed by taking a temperature reading five feet off the floor in the center of a cold aisle. Figure 2 below shows a temperature map of server inlet temperatures in a row of cabinets. The second cabinet from the right of this row has equipment installed backwards. Air delivery is from the duct above the cold aisle. The temperature map suggests that the center of the cold aisle five feet above the floor may be more than adequately cooled, but measuring that temperature will not account for the hot spot on the far right cabinet. The hybrid layout of temperature sensors that includes top, middle and bottom intakes of end-of-row racks would readily expose this problem spot.
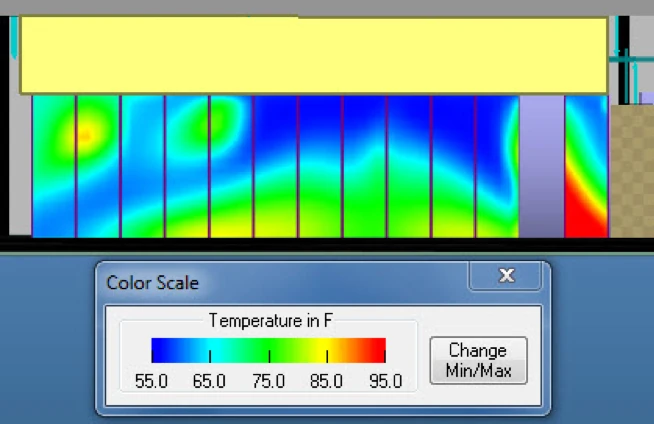
Figure 2: Overhead Air Delivery and Reversed Rack
The center-of-row temperature readings not only may miss problem racks, but may also deliver false-positive readings of out-of-spec temperature. Figure 3 below shows another example of some reversed airflow equipment, this time viewing from the end of the rows looking at a slice down the row where the problem cabinet is located. In this case, a center of row temperature reading might be non-compliant, i.e., 85˚F versus a recommended 80.6˚F maximum. Because of the volume and temperature of delivered air into the cold aisle, the temperature of the air actually delivered to servers may very well be within the recommended guideline and would be accurately recorded by top, middle and bottom permanently mounted temperature sensors.
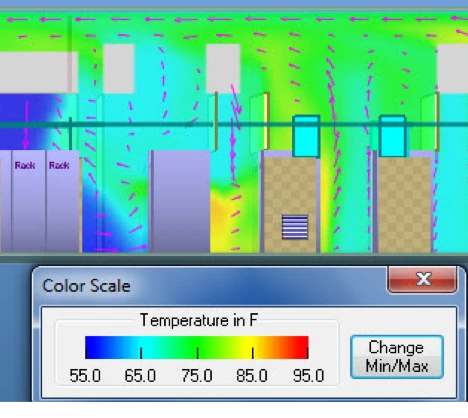
Figure 3: Potential False-Positive High Temperature Reading
While I have provided some examples here from past experience that support my preference for a hybrid temperature sensor placement plan combining the ASHRAE maintenance and set-up temperature measurement recommendations, the more important emphasis needs to be on correcting generally faulty practices. Unfortunately, apparent expertise does not always offer reliable protection against bad practices. For example, the following comes right out of the technical documentation of a temperature sensor manufacturer with a market focus on data centers:
“Best Practices…(requires) multiple temperature sensors…placed on top, middle, and bottom of individual racks to measure the heat being generated by equipment, and at the air conditioning system’s intake and discharge vents, to measure efficiency.”4
There is nothing in this vendor’s statement of best practices to suggest we measure the temperature of the air that the IT equipment is actually ingesting. While there can be reasons for measuring the heat generated by IT equipment, in conjunction with a plethora of other measurements to fine-tune efficiency, I have said many times in the past that with an effective airflow management containment arrangement, we really do not need to be concerned with the temperature of that waste air. That may be a slight exaggeration, particularly if we are trying to exploit opportunities for partial free cooling that is available when outside ambient conditions are lower than return air temperatures. Nevertheless, it does not represent a threat to the health of our IT equipment, but does represent that “expert” vendors may not be the most reliable resource on deployment of their solutions.
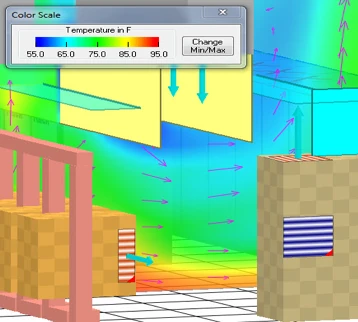
Figure 4: High Temperature in Empty Row
Figure 4 above represents another example of misplaced sensors from an unexpected source. In this case, the source is a colocation data center – these are the professionals who operate the data centers so the rest of us amateurs do not need to suffer the consequences of our long and steep learning curves. In this case, a temperature sensor was located in an empty row across from a row of switch racks. The sensors recorded high temperatures, leading the tenant to believe the data center had failed to fulfill part of their service level agreement. There was no IT equipment located in the area measured by the sensor, so the whole uncomfortable conversation could have been avoided by either moving or disabling the sensor.
As I noted in my August 22 blog to kick off this series on managing airflow management, if our only objective is to avoid or mitigate hot spots, then precisely locating precision temperature sensors may not be that critical. However, if the goal is to maximize total mechanical plant efficiency while meeting a pre-determined environmental target for the IT equipment, then intelligent use of temperature sensors becomes much more critical. The methodology I presented in that blog of minimizing the difference between the top sensor reading and bottom sensor reading in each rack is the safest and most straightforward path to realizing the economic benefits of raising temperatures while adequately cooling IT equipment. Barring tapping into servers’ on board temperature monitoring or deploying temperature sensors in every cabinet, the hybrid model I have suggested here with top, middle and bottom sensors in end-of-row racks and center-of-row racks can effectively provide reliable data points for managing temperatures and enabling mechanical plant efficiency measures. My September 12 and October 3 pieces on cooling efficiency algorithms assume the capability of collecting this data and utilizing it through DCIM or some BMS interface to manage mechanical plant behavior. My subsequent pieces in this series will be based on this same capability, as well as an upcoming piece on dialing in an operation after a major airflow management improvement project. With that, let’s get back on the bus and get back into the nitty gritty of additional algorithms and process roadmaps in the coming months.
1 “The Shifting Conversation on Managing Airflow Management: A Mini Case Study,” August 22, 2018; “Cooling Efficiency Algorithms: Coil Performance and Temperature Differentials,” September 22, 2018; “Cooling Efficiency Algorithms: Chiller Performance and Temperature Differentials,” October 3, all at https://www.upsite.com/blog/
2 Thermal Guidelines for Data Processing Environments, Third Edition, ASHRAE TC9.9 page 54
3 IBID, page 56
4 Sensor manufacturer technical brochure. We will protect the guilty and hope they see this and make appropriate corrections.
Airflow Management Awareness Month 2019

Ian Seaton
Data Center Consultant
Let's keep in touch!
0 Comments