Is Your Data Center PUE Just PU?16 min read

For the benefit of anyone who may have joined the conversation somewhere in the middle, let me remind everyone that the purpose of the PUE (power usage effectiveness) metric was initially proposed to be an easy-to-use internal reference point for defining energy efficiency initiatives in data centers and measuring progress against those initiatives. After all, what could be simpler than measuring how much power was applied to the whole data center and how much was applied to the computing equipment and then performing the necessary arithmetic activity of dividing the big number by the less significant number? Apparently, it is not quite that simple. It turns out the big number can vary significantly over the course of a year, especially when free cooling is part of the equation. Likewise, the less significant number can vary based on seasonal or temporal workload fluctuations and can be bigger or smaller based on where it is measured, for example upstream of the UPS versus at the device plug. However, why should any of this matter? After all, if this is a strictly internal metric to drive efficiency improvements and, internally, it is always measured the same, then methodology fine-tuning, clarification and scrupulousness are more of a pedantic exercise than a continuous improvement exercise. Unfortunately, the concept of PUE got co-opted by marketing and sales so the conversation became “My PUE is better than your PUE” instead of, ”My goal for this year is to reduce my PUE by 10%” or “My goal for the new data center is to achieve a 20% lower PUE than my current portfolio of properties.” So if I am making the proposition that some of my readers’ PUE may be more of a P-ew, am I merely promulgating the theft of PUE by the hawkers and hucksters? Not necessarily. There are two ways a PUE could be a little stinky: 1. It’s not so good. 2. It’s a lie. In both cases, the stinkiness does not necessarily depend on external comparisons but does bear on internal consequences.
So how can you tell if that funny smell is your data center PUE with a misplaced “E” – that is to say, how do we know if we have power usage without much effectiveness? This could be where I get accused of introducing the ironic part of this blog. The average PUE for all data centers is still somewhere between 2.0 and 2.5, although the average PUE for data centers brought on line within the last couple years is around 1.6, so we could say that measurements above 1.6 might fall into the not-so-good category. However, in my last piece in this series where I dollarized data center delta T controls and implications, I walked through how good airflow management that minimized the differential between cooling equipment supply and return ΔT and IT equipment intake and exhaust ΔT should be able to support PUEs in the 1.40’s, prior to harvesting any further economies from free cooling. So then it becomes a question of how somebody chooses to define “good enough.” From my sniffing point, a 1.60 PUE means about one million kW hours of energy per year per megawatt of IT load is being unnecessarily consumed due to poor airflow management practices. We all have different olfactory thresholds, but I’m going to call that “not so good.”
That “not so good” bar can go even lower when we introduce any one of various approaches to free cooling and establish server inlet temperature boundaries within the ASHRAE allowable environmental envelope rather than being restricted to the recommended temperature ranges. When both free cooling and allowable temperature thresholds are in play and data centers have not been carelessly site-selected in places like Death Valley, Dallol, my truck parked outside in the central Texas summer, or hell, then we start to get into brag-worthy PUE levels, which brings us back to the misappropriation of PUE by the sales and marketing folks. The periodic press releases citing sub-1.10 PUEs with the intent of wrangling bigger chunks of brand equity by these Herculean accomplishments are exactly what the developers and promoters of the PUE metric did not intend. Nevertheless, as we like to say here in these parts of Texas, “It ain’t braggin’ if it’s true,” and at least some of these claims appear to be true. Nevertheless, all that matters for the internal sniff test is that if there is no free cooling and the PUE is coming in at 1.50 or higher, then continuous improvement efforts will pay for themselves with additional energy savings. Likewise, if there is free cooling in play and PUE is higher than 1.40, then there is still plenty of room for improvement. Finally, if there is no free cooling for a particular site or if there is a strict adherence to the 64.4˚F to 80.6˚F recommended range for server inlet temperatures, then there is a crucial decision-maker in need of some continuing education. May I suggest a good starting place as my postings last year for May 3, May 17, May 31, June 14 and July 12 on the Upsite Technologies blog site.
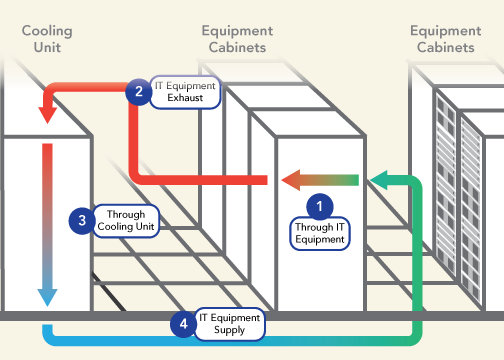
A whole other way to look at this question of whether PUE might be PU is to consider the ΔT mapping I discussed in my previous four pieces here. Referring to Figure 1, if there is more than 2˚F difference between ΔT1 and ΔT3 or if there is greater than 2˚F ΔT between the beginning and end of 4 (supply) or a greater than 2˚F drop between beginning and end of 2 (return), then there are reasonably achievable airflow management improvements available to reduce PUE further.
When PUE is a lie, on the other hand, it is not always PU but sometimes might only be P-ew. For example, a data center could have a mechanical load component (MCL) of 0.15. MCL is calculated by dividing the energy for all the cooling elements (cooling + pumps + heat rejection fans + air handler fans) by the IT load. It is essentially the cooling-only part of PUE, so an MCL of 0.15 would build up to a 1.15 PUE, before adding in the electrical loss component (ELC), which might come up to another 0.05 for losses at all the different points of power transformation, thereby bringing our hypothetical PUE to 1.15+0.05=1.20, before we consider other elements such as lighting and the IT manager’s coffee pot. Under the circumstances, 1.25 seems reasonable. So what happens when the folks monitoring his data center miscalculated the proportion between some partial load UPS losses and full (relatively speaking) UPS load losses and their ELC was 0.08, resulting in a 1.28 PUE? It seems that they get to keep their E (effectiveness) in PUE, and they get just a little P-ew for their inadvertent lie. Why is this important? Much of the current PUE conversation includes such miscalculations, which only matter because of how the whole concept of PUE has been misappropriated for agendas different from the original purpose for mapping continuous internal improvement. So if we ignore all the PUE noise, except for perhaps the self-reporting of self-improvement, then the “lies” only matter when we change the rules internally. For example, PUE is being calculated based on IT load on UPS and then the data center upgrades to intelligent rack-mount PDU’s which allow for monitoring at the plug, and suddenly the IT load shrinks a smidgen resulting in a higher PUE.
I snuck an essential distinction in the previous paragraph, but for the sake of any speed readers who may have skimmed over it, I am very confident that the vast majority of PUE lies are inadvertent, notwithstanding the crush of one-upping gamesmanship in our industry. A now classic example of an unintentional PUE lie comes from PUE improvements resulting from increasing data center temperatures and exploiting the guidelines on allowable server inlet temperatures. The first definitive study I remember on this topic with reasonable controls was a presentation by Hewlett-Packard at the 2011 Uptime Symposium. The results are summarized in Table 1. The researchers began by defining a unit of work as completing a certain number of transactions in a suite of applications on some aggregate of hardware. They assured themselves they could capture all the costs of the data center for performing a unit of work – all the computer and network equipment, complete mechanical plant and electrical distribution. They modulated supply temperatures and stabilized the space at four different server inlet temperatures and recorded all the energy use at each temperature. As expected, they found PUE kept getting better at each increase in temperature. However, while total cost to complete a unit of work decreased from 68˚F to 77˚F, at higher temperatures, the operating expenses increased. The inverse proportions for PUE and operating cost were attributed to the extra energy the servers were consuming to ramp up internal fans at higher inlet temperatures. This was the seminal study that established 77˚F as the economic sweet spot for harvesting chiller savings at higher temperatures without giving back those savings in higher energy for ramping up server fans. Since that server fan energy was part of the denominator for the PUE calculation, PUE kept getting better despite the overall higher energy use.
| ECONOMIC IMPACT OF SERVER INLET TEMPERATURES | ||
| Server Inlet Temperature | Cost to Complete Unit of Work | PUE |
| 68˚F | $510 | 1.27 |
| 77˚F | $501 | 1.20 |
| 86˚F | $565 | 1.19 |
| 95˚F | $605 | 1.18 |
While these low PUE’s derived from increasing data center temperatures may technically be a lie, the conventional wisdom that has grown up around the HP study and subsequent research, mainly by Dell and APC, may not be lies, but it is wrong-headed jumping to a conclusion. When higher temperatures stretching toward the boundaries of the ASHRAE allowable limits are executed with highly effective airflow management practices in conjunction with any number of economizer options, the overall operating cost savings easily offset any increases in server fan energy. While these early studies either focused on the contribution of chiller plant efficiency or DX cooling or in-row cooling, my blog titled, “Airflow Management Considerations for a New Data Center – Part 1: Server Power versus Inlet Temperature” clearly demonstrates economic sweet spots in excess of 90˚F server inlet temperature are achievable in many geographic areas with a variety of economizer topologies.
A brilliant antidote for some of this P-ew stinkiness was developed by the Energy Efficient High-Performance Computing Working Group and presented by Michael Patterson of Intel in an award-winning paper, “TUE, A New Energy Efficiency Metric Applied at ORNL’s Jaguar.” There is a two-step process to applying the TUE (Total Usage Effectiveness) which begins with first determining a PUE-type assessment of the IT equipment – a metric he calls ITUE. ITUE is the total energy going into the IT equipment (infrastructure burden+IT) divided by IT, where infrastructure burden includes the power supply, voltage regulator, fans, pumps, board level electrical resistance losses, indicators, platform controls and IT includes CPU, storage, memory, and networking. Then TUE can be calculated by PUE X ITUE, or total power from the utility divided by true IT (memory+storage+CPU). In the paper, Michael Patterson walks through an example where a data center with high-efficiency servers (lower losses and usage for voltage regulators, fans, and power supplies) has a worse PUE than a data center with older or cheaper inefficient servers, yet has a lower total operating cost by the server efficiencies. The TUE calculation accurately captures the advantage of the efficient servers. The paper further reveals the positive results from a case study research project in a live data center. This metric was introduced nearly five years ago but does not appear to have gained any traction outside the HPC community, probably due to some difficulties in isolating the actual energy use of sub-systems inside our computer equipment.
So, is your PUE closer to PU? First, don’t answer that question concerning what you have read from self-promotional horn tooting or, conversely from full frontal assaults on the inadequacies of the PUE metric. If your PUE is above 1.40, then you have an excellent opportunity to reap quick returns on investment for improving airflow management and mechanical infrastructure. Conversely, if you are caught in an inadvertent PUE lie (P-ew), then you need to be sure that efficiency improvements that do not create PUE improvements are accompanied by sound data collection on overall operating costs for the data center. Furthermore, it’s another good reason to keep the PUE metric applied as intended, for tracking internal objectives: 1. Avoid the old egg on the face (a whole other level of P-ew) or, worse yet, 2. Avoid doing the right thing because you are invested in a metric that will not reward you.

Ian Seaton
Data Center Consultant
Let's keep in touch!
Airflow Management Awareness Month
Free Informative webinars every Tuesday in June.
0 Comments