The Importance of Mutual Understanding Between IT and Facilities – Part 2: Specifying A1, A2, A3, or A4 Servers20 min read

Different server classes operate at different maximum temperatures, resulting in more free cooling hours, significantly reducing operating cost.
Different maximum server temperatures result in different chiller operating conditions and may mean no chiller is required at all, thus dramatically reducing operating cost and potentially significantly reducing the cost to construct new data centers.
In order to at least begin the process of building a fully integrated data center that functions as an ecosystem wherein all the various elements are mutually supportive to optimize the IT, mechanical and electrical functions, decisions about servers should include more variables than the previously-described impact of rack-mount servers versus blade systems and all the associated application compatibility and I/O versus raw power considerations. Servers can also be categorized by their operating temperature boundary requirements, and these categories can have a dramatic effect on the operating energy budget of a data center, the total cost of ownership of a data center operation, and the mechanical robustness of the data center. These categories were formalized by the ASHRAE Technical Committee 9.9, IT sub-committee in a 2011 white paper, and then in the third edition of its handbook on environmental guidelines for data center computer equipment (summarized in Table 2).
However, before exploring the ramifications of IT decisions from the data in this table, we should first be clear on the source of this information as a pre-emptive strike against concerns that the server manufacturers would not cooperate with any of the recommendations and suggestions. The developers of these guidelines, i.e., the members of the ASHRAE TC9.9 Mission Critical Facilities IT sub-committee are, in fact, the server OEMs – research fellows, emeritus scientists, and graduate-degreed engineers representing those companies comprising over 70% of the global server market3 as well as the bulk of the server microprocessor industry. Nothing is being proposed beyond the published and well-understood capabilities of the data processing equipment that typically finds its way into data centers and computer rooms. With that pre-emptive clarification, then, we can explore these additional procurement options facing today’s IT managers and what they mean for the overall effectiveness and efficiency of the data center.
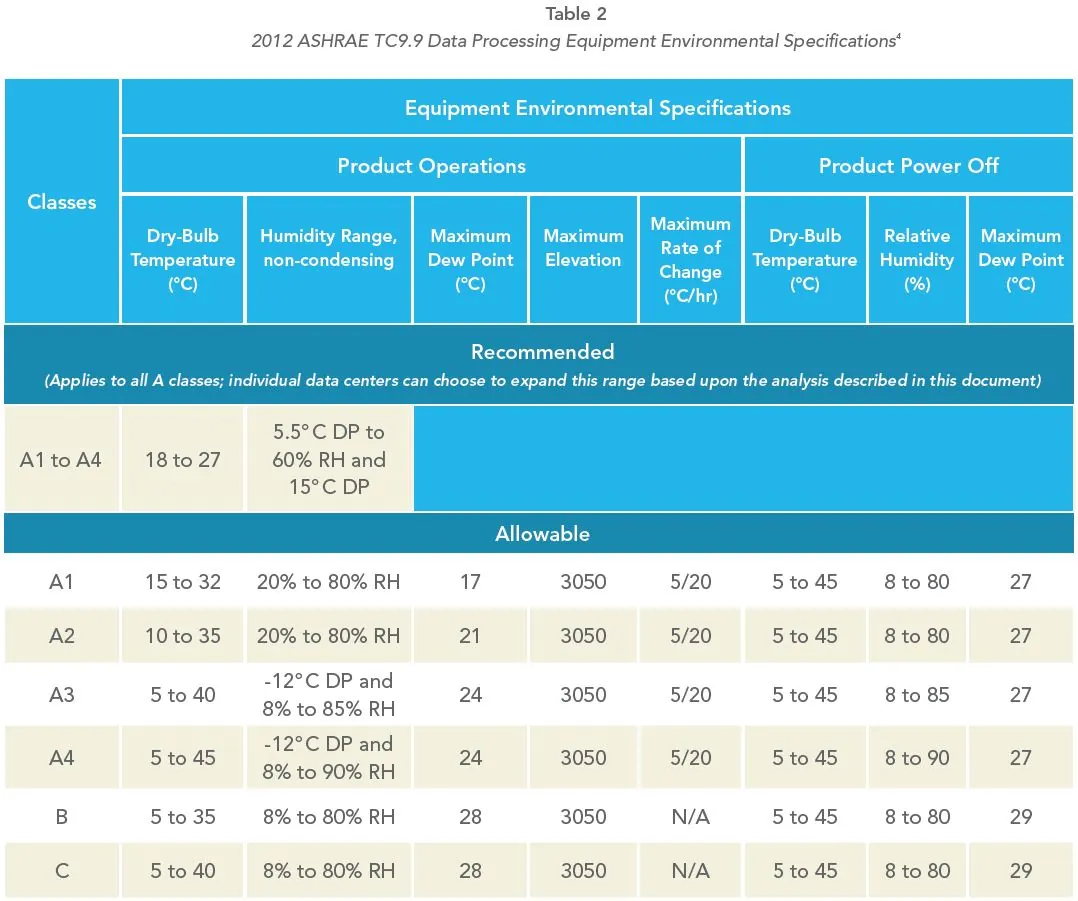
The 2011 ASHRAE environmental guidelines maintained the recommended server inlet temperature range established in 2008 of 64.4° F to 80.6° F, but expanded the allowable temperature range and corrected a problem it had introduced in applying the allowable range. The ASHRAE paper that introduced the first expanded temperature range advised that it was OK to operate within the allowable range for short periods of time, without ever defining a “short period of time.”5 ASHRAE’s 2011 white paper and third edition of the handbook provide clear direction on how to systematically determine an acceptable short period of time for any data center. What follows is an extremely abridged synopsis of the steps for determining that “short period;” the authors encourage the reader to consult the handbook and include this analysis as part of the normal prespecification/acquisition due diligence.
The ASHRAE IT committee members accomplished an unprecedented level of cooperation by establishing what they called an “X” factor, which represented an expected reliability level that would be achieved by operating a data center with every server ingesting 68° F air 24/7 over the life of the data center or over the life of a technology refresh. They then agreed on percentage levels up or down from that baseline based on how many hours servers would receive air either below or above that “X” factor baseline. The handbook then presents case study examples on how to use the guidelines. In one example, it describes a data center in Chicago using air-side economization free cooling that allowed the data center temperature to fluctuate, following Mother Nature’s lead, within a particular allowable range. Temperatures below the low threshold were accommodated merely by re-circulating return air to keep the supply warm enough, and temperatures above the high threshold were addressed with standard mechanical cooling. In the Chicago example, the server equipment reliability actually improved by 1%.
Interpretation of the results of this exercise merits a word of caution. For example, if the calculations using hourly temperature bin data for the data center location indicated that allowing the data center temperature to fluctuate based on anticipated weather conditions would produce a 5% increase in server failures, what does that actually mean? If the data center had 1000 servers and the experience from the particular vendor translated into an expected 0.5% failure rate, that would mean an expectation for five failed servers somewhere during their lives. A 5% increase over five servers means that allowing the data center temperatures to fluctuate up and down within one of the allowable ranges would result in increased failures of ¼ of a server, or 1 out of 1000 over four years, which may actually be longer than the technology refresh for some data centers. Determining the scale of this perspective and what might be acceptable should be a preliminary step before making decisions about server classes that can have profound effects on both the design and efficiency of the data center mechanical plant.
For the Celsius-challenged, the allowable range for Class 1 servers from Table 3 is 59° – 90° F, for Class 2 servers is 50° – 95° F, for Class 3 servers is 41° – 104° F and for Class 4 servers is 41° – 113° F. It will still be difficult to find manufacturer designations for these classes on the standard marketing or user documentation; however, these ranges will correspond to the operating temperature ranges that are readily available on all manufacturers’ standard documentation.
Just for perspective, the very significant majority of servers sold at the time of writing this paper fall into the Class 2 range. Class 4 servers today are typically the extremely ruggedized servers for military or other harsh field applications. Class 3 servers fall somewhere between those extreme ruggedized servers, which typically come at a significant price premium, and what we find in most commercial critical facilities. As data center operators become more familiar and comfortable with incorporating this type of analysis as part of the standard specification and acquisition process, we can expect more attractive pricing on servers with these temperature specifications but without the rest of the ruggedized architecture. All that notwithstanding, those price premiums should not, as a matter of course, disqualify these servers from consideration, particularly considering the impact on total cost of ownership available in many situations.
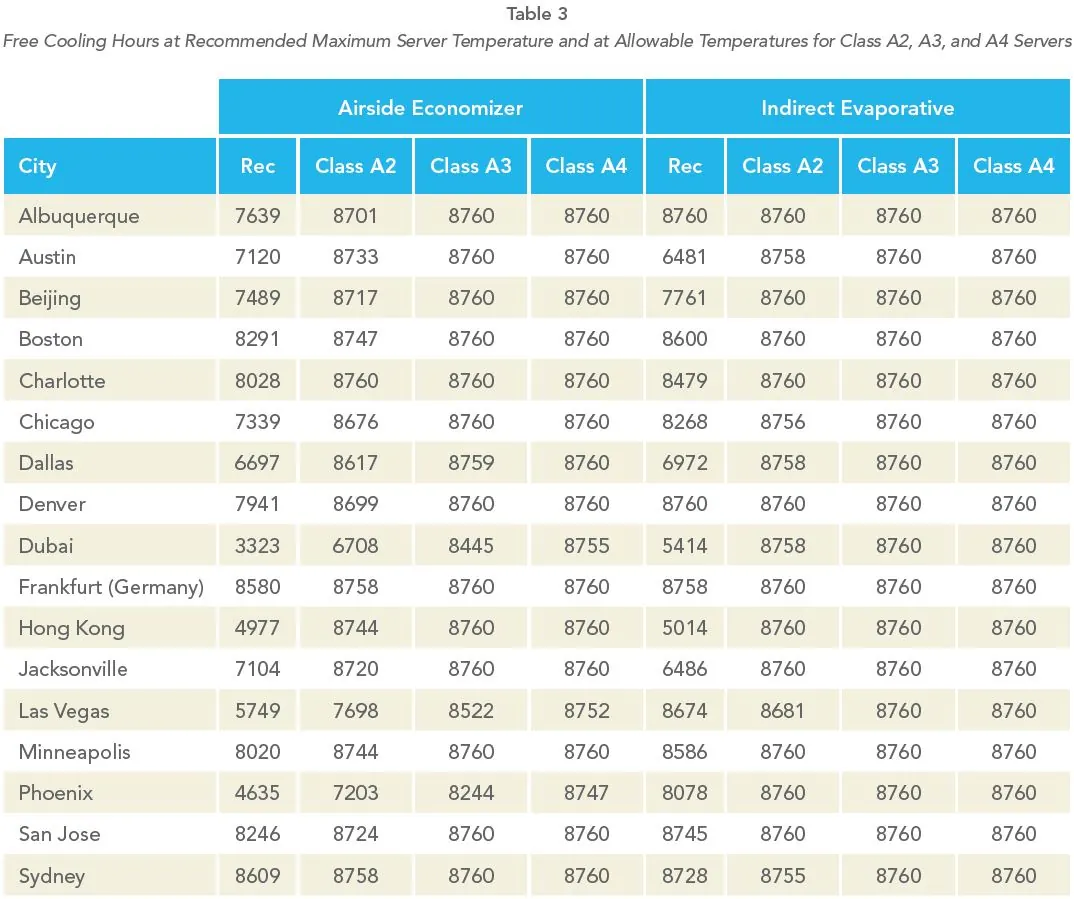
Table 3 shows the potential opportunity for free cooling at allowable temperature maximum thresholds for different classes of servers. Airside economizer hours are based on dry bulb temperatures for the indicated cities and indirect evaporative cooling hours are based on wet bulb temperatures for those cities. The other primary difference between the two example scenarios is that airside economization allows outside air into the data center, whereas indirect evaporative cooling, by definition, conducts heat transfer through a heat exchanger that keeps outside air separated from inside data center air. Between the two types of free cooling, the table clearly shows that data centers in Albuquerque, Boston, Chicago, Beijing, Denver, Frankfurt, Hong Kong, Jacksonville, Minneapolis, Phoenix, and San Jose could cool data centers with Class A2 servers (typical commercial servers today) all year without ever using any refrigerant mechanical cooling. In addition, Austin, Charlotte, Dubai, Las Vegas and Sydney could cool Class A3 servers all year with one form or the other of free cooling. While this is obviously only the first step of the analysis, the fewer hours between the ASHRAE-recommended maximum temperature and the allowable temperature, the more likely the “X” factor reliability forecast will justify allowing the temperature fluctuations. So what does that mean?
One path suggested by such an analysis is a data center design completely devoid of any chiller or other refrigerant-based mechanical cooling system. Such a design not only saves on the cost of mechanical cooling, which is the single largest operational cost of a data center after energy required to power the IT equipment, but it could also save on the capital investment of the mechanical cooling plant and the real estate space required for its deployment. On the other hand, a budget analysis might indicate that Class A3 servers over the three to six technology refreshes that might be planned for a data center life might actually be a higher investment than building a chiller plant and associated systems; in this case, the return on investment would be the operational savings for using free cooling for 80% or 90% of the year, or whatever the bin data indicate should be expected. Even in this scenario, it’s possible that a capital savings could be achieved by using the free cooling facility and the allowable hours bucket as the redundant back-up to the chiller, and thereby provide relief from the capital investment for redundant chillers and air handlers or CRAC units. Even in cases where the traditional mechanical plant is designed with an N+1 level of redundancy, the free cooling capability and the allowable temperature hours bucket can provide another level of redundancy, raising the cooling system from a basic level of availability protection to a more clearly fully fault tolerant and simultaneously maintainable capability, for a level of robustness that otherwise might not be affordable.
By this time, after looking only at the potential differences between standard rack mount servers and blade systems and the opportunities associated with the new ASHRAE TC9.9 server classes, it should be clear that server acquisition choices have a bigger impact on the mechanical operating efficiency of a data center than do choices of CRAC units, heat rejection strategies, chillers, and those elements typically under the authority of the functional areas responsible for the data center energy budget. And there are many more decisions belonging to the IT functional area that directly impact both the overall operational efficiency of the data center as well as the effectiveness and robustness of its design.
3IDC Worldwide Quarterly Server Tracker, December 2014
4Thermal Guidelines for Data Processing Equipment, 3rd Edition, ASHRAE, 2012
5Environmental Guidelines for Datacom Equipment: Expanding the Recommended Environmental Envelope” ASHRAE, August, 2008, p.2.
Real-time monitoring, data-driven optimization.
Immersive software, innovative sensors and expert thermal services to monitor,
manage, and maximize the power and cooling infrastructure for critical
data center environments.
Real-time monitoring, data-driven optimization.
Immersive software, innovative sensors and expert thermal services to monitor, manage, and maximize the power and cooling infrastructure for critical data center environments.

Ian Seaton
Data Center Consultant
Let's keep in touch!
0 Comments