What Is the Difference Between ASHRAE’s Recommended and Allowable Data Center Environmental Limits? – Part 422 min read

There are several differences between ASHRAE TC 9.9’s recommended and allowable environmental limits for data centers, depending on who you ask. On the surface, the most straightforward differences would be the actual numbers in the ASHRAE publications. Guidance on applying those differences is provided by TC 9.9 in Thermal Guidelines for Data Processing Environments, 4th edition, as well as in associated white papers and technical briefs. This guidance has been further clarified and confused in numerous conference presentations, journal articles, and water cooler discussions. Of all the differences between the recommended environmental limits and the allowable environmental limits, the most consequential may very well be the impacts on organizational bottom lines and the competitive landscape in our industry.
Before exploring the differences in more detail it is worth noting that this discussion will touch on a wide variety of temperature and humidity readings, but in all cases the only readings that really matter are at the server air in-take. Most importantly, the server in-take and supply temperatures are not the same thing and can be significantly different depending on the quality of airflow management in the data center. With effective isolation of supply air from return air, there could be as little as 1˚C difference between supply air and any individual server inlet; however, in well-organized hot aisle – cold aisle architectures with inconsistent blanking panel discipline, that difference can easily be 5˚C and where side-breathing switches are ineffectively integrated with standard front-to-rear breathing equipment we have seen the difference between supply and maximum server inlet exceed 15˚C (27˚F). In the old days, before airflow management reached buzz word status, we regularly saw 13˚C (55.4˚F) supply temperatures with isolated maximum server inlet temperatures exceeding 30˚C (86˚F). As in previous installments of this series, I will be referencing various ambient dry bulb and wet bulb conditions and any impact on server inlet temperatures will always be based on the cumulative approach temperature between the ambient condition and the server inlet. For example, an indirect evaporative cooler might have a 3.9˚C approach between ambient wet bulb and the supply dry bulb plus a 1.5˚C ΔT between the supply and any particular maximum server inlet. Hopefully, it goes without saying that a traditional return set-point has no place in this discussion since the relationship between set-point and server inlet is subject to nearly infinite variables to the point of being statistically random and only predictable by carefully scrupulous computational fluid dynamics models.
The difference between the recommended envelope and allowable envelope is actually the difference between the recommended envelope and several allowable envelopes. This is old news: recommended temperature envelope for all servers is 18˚C to 27˚C and the recommended humidity envelope is a dew point range from -9˚C to 15˚C, with a maximum 60% relative humidity. The allowable ranges, on the other hand, are divided into four server classes: A1 @ 15-32˚C (59-89.6˚C), A2 @ 10-35˚C (50-95˚F), A3 @ 5-40˚C (41-104˚F), and A4 @ 5-45˚C (41-113˚). The humidity range for classes A1 and A2 is -12˚C dew point and 8% RH to 27˚C dew point and 80% RH; the other classes are the same except class A3 has an 85% maximum relative humidity and A4 has a 90% maximum relative humidity. There is no rate of temperature change recommendation since the total envelope is so narrow; whereas the maximum allowable rate of temperature change for equipment with spinning media is 5˚C per hour for all classes and 20˚C per hour for solid state storage. This is not an absolute number specification, but rather a relative specification – the temperature does not need to change 5˚C absolutely. Rather, if it changes 3˚C in 15 minutes, it has effectively changed at a faster rate than 5˚C in 60 minutes. Most of us in the industry have had these numbers memorized for quite some time, but many of us still do not feel wisely empowered.
The numbers themselves do not adequately explain the difference between the recommended and allowable environmental limits for data center equipment. The simple answer comes right out of the ASHRAE book, as well as in most articles and conference presentations on the subject, not to mention in several comments to my previous installments of this series. The recommended limits are established as a guideline for promoting the long term health and reliability of IT equipment, while the allowable limits recognize the published warranty conditions of IT OEMs and therefore allow for short operating excursions into the wider environmental envelopes. I will unpack a couple elements of that definition. First, these environmental limits are guidelines and not hard “shall” standards or specifications; hence the title of the ASHRAE book as well as the strong clarification, “Some still felt the recommended envelope was mandatory, even though that was never the intent.” (Thermal Guidelines for Data Processing Environments, 4th edition, page 19). Second, the TC9.9 folks did us a great service by developing the “X” factor so each of us could determine our own definition of what constituted an acceptably short excursion out of the recommended envelope into the allowable envelope.
Based on comments and questions posted to some of my previous pieces, apparently some further clarification of this “X” factor business is in order. We are not told what “X” is beyond it being the rate of server failures we should expect to see if those servers ingested 20˚C (68˚F) 24/7 all year long. What we are told more specifically is the variation in that failure rate at inlet temperatures below 20˚C (fewer) and above 20˚C (more). This model was developed from data brought to the table by the IT OEMs themselves based on all the data they collected from their customers’ user experience. Understandably, that is why we do not get a hard figure for “X” – they are at the table with their competitors and can be expected to open that kimono only so far. It is remarkable, in fact, that we got we what have to work with, which is a lot. So if we have some experience with server failure rates over time, then we can actually drive this metric to some hard numbers. However, this calculation is not quite so straightforward as it might initially appear. For example, my server failure experience over the past couple years was not likely based on a constant 68˚F server inlet temperature. I may have had a legacy hot aisle – cold aisle data center with a 70˚F set point resulting in a few servers ingesting 60˚F air, a few ingesting 80˚F air and the vast majority ingesting air between 74˚ and 78˚F. Conversely, I may have had excellent airflow management in conjunction with an economizer so my supply temperature varied between 64˚F and 80˚F, fluctuating with the fickleness of Mother Nature, resulting in server inlet temperature 1-2˚F higher than the supply. Regardless, I am going to need to calculate my hours of exposure to the different “X” factor temperature bins in Table 1, so my baseline will not be the 1.00 corresponding to 20˚C (68˚F) 24/7 server inlet temperature. If my baseline turns out to be 1.24, then it is easily conceivable that my projected failure rate operating within the full allowable range (10˚-35˚C, or 50˚-95˚F) might be lower than when I was operating within the recommended range if my data center is located where a significant part of the year is seeing temperatures below 17˚C (64.4˚F)
|
Table 1: Server Failure Rates at Different Server Inlet Temperatures
For those readers who objected to my previous assertions that most data centers should expect to see lower server failure rates operating within the allowable range versus the recommended range, I refer you to Figure 1, showing wet and dry bulb temperature distribution for Bend, Oregon for a recent year. This is the same type of information the TC9.9 folks presented for Chicago in the Guidelines book as well as in an associated white paper and technical brief and which I have previously presented in tables of data for fourteen different data center locations. Perhaps a picture will be more compelling. Because I am taking a bit of a granular look at temperature in four degree buckets, the bell-shaped curves, while recognizable, are not the prettiest you have ever seen. Nevertheless, the lines show clearly enough where the preponderance of both dry bulb and wet bulb temperatures fall.
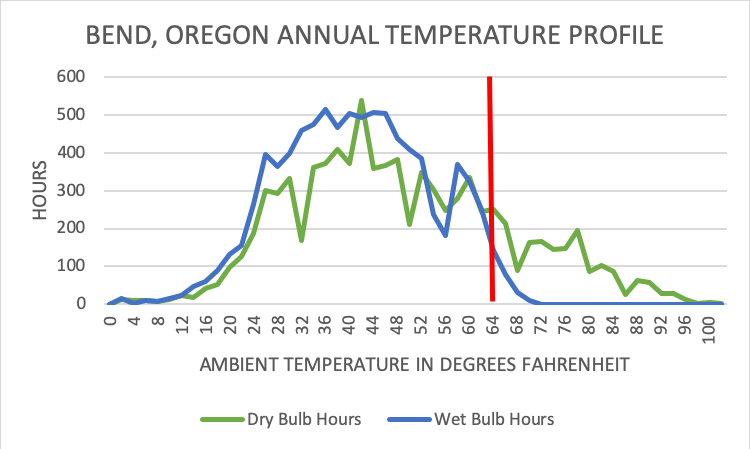
Figure 1: Example of Ambient Wet Bulb and Dry Bulb Annual Temperature Distribution
As a reference marker in Figure 1, the red vertical line represents the lower threshold of the recommended temperature limits for server inlet air. All those hours to the left will produce server failure rates from 13% to 28% below the expected failure rates for servers ingesting 68˚F air 24/7. Let’s get realistic here for just a minute. Those outside ambient temperatures are not what our IT equipment is going to see, so we move our red line around a little. With our assumption of excellent airflow management in the data center, we can move that red line to the left a couple degrees to 62˚F for an airside economizer to deliver 27˚C (64.4˚F) to our IT equipment. In our sample year for Bend, that would be 76% of the year under the minimum recommended temperature; 69% of the year would produce server failure rates 28% below the 20˚C (68˚F) baseline and another 7% of the year would produce failure rates 13% below that baseline. More dramatic, however, is where that baseline falls in reality– few of us are delivering 20˚C at the in-take to all our IT equipment. If that number has been 22˚C (71.6˚F), then our expected server failure rate would be 37% lower for 69% of the year, 22% lower for 7% of the year, and 9% lower for another 11% of the year. If that actual baseline had been 25˚C (77˚F), then 69% of the year would produce 48% fewer failures; 7 % of the year would produce 33% fewer failures; 6% of the year would produce 20% fewer failures, and 5% of the year would produce 7% fewer failures. If you do the math on this one, that leaves about 3% of the year at the baseline failure rate and only 10% of the year in the higher failure rates ranging from 75˚F up into the low 100˚s. The preponderance of hours at temperatures with anticipated failures rates below the baseline more than compensates for the higher “X” factor numbers at the higher temperatures, resulting in improved server reliability operating within the class A2 allowable limits than at either 68˚F or varying within the recommended temperature limits.
NET CHANGE IN SERVER FAILURES IN DATA CENTER OPERATING WITHIN A2 RANGE VERSUS MAINTAINING A CONSTANT 72˚F INLET TEMPERATURE
| Location | Direct Air | Indirect Air | Water-Side | Indirect Evap |
| Amsterdam | -14 | -10 | -5 | -12 |
| Atlanta | -3 | 0 | +1 | -4 |
| Chicago | -8 | -6 | -4 | -9 |
| Dallas | -1 | +3 | +4 | -2 |
| Denver | -9 | -7 | -9 | -13 |
| Frankfort | -12 | -4 | -6 | -12 |
| Hong Kong | +6 | +8 | +14 | +6 |
| London | -15 | -7 | -12 | -13 |
| Omaha | -7 | -4 | -3 | -7 |
| Phoenix | +4 | +7 | +1 | -6 |
| Reston | -6 | -4 | -3 | -7 |
| San Jose | -8 | -4 | -2 | -9 |
| Sydney | -4 | 0 | +3 | -3 |
| Wenatchee | -10 | -9 | -8 | -14 |
Table 2: Net Change in Server Failures in a Data Center operating within A2 Allowable Range versus Maintaining a Constant 72˚F Server Inlet Temperature
The basic methodology described in the previous paragraph was replicated for each of the fourteen data center locations in Table 2, previously presented in the second installment of this series on the differences between the recommended and allowable ASHRAE temperature guidelines for data processing equipment. The operative ambient conditions for each economizer type were factored by the cumulative approach temperatures rising through the entire process between where the ambient air enters the process to the inlet point for the IT equipment. As you can see in the data, Hong Kong was the only studied location to actually have an increase in server failure rates from the baseline condition. Nine of the fourteen locations had fewer failures in each of the four different economizer types. The blue shaded cells indicate data centers with no refrigerant mechanical cooling and operating completely within the class A2 allowable limits. For those data centers requiring air conditioning to avoid any exposure above the maximum class A2 server inlet temperature, actual capacity (tons, BTUs, CFM, etc.) required, ranged from 25% to 60% of standard engineering practice and run time for that capacity ranged from less than 1% of the year up to 55% of the year, depending on economizer type and location.
And that brings us to the most important difference between the recommended and allowable environmental envelopes for data processing equipment: cost of designing, building and operating the data center. The allowable envelope allows us to build our data center in most locations without a chiller and any precision cooling units (CRACs or CRAHs.) If we did not have to write a check to buy the equipment, we obviously do not have to pay to operate it. In those few locations where some air conditioning is going to be required to maintain server inlet temperatures below the class A2 maximum allowable threshold, the capital investment can be greatly reduced over what would be required to operate within the recommended range, and that investment may only need to operate on-line for a very few hours every year. Finally, there is still some chatter about higher fan energy costs at higher temperatures. I have covered this in detail elsewhere (Airflow Management Considerations for a New Data Center: Part One – Server Power versus Inlet Temperature), but the bottom line is similar to the reliability calculations emanating from data like that illustrated above in Figure 1 and that we get more fan law benefits from that big lump of hours on the left side of the chart versus any penalty we suffer during the small number of hours on the right of the chart.
Airflow Management Awareness Month 2019
Did you miss this year’s live webinars? Watch them on-demand now!

Ian Seaton
Data Center Consultant
Let's keep in touch!
Airflow Management Awareness Month 2019
Did you miss this year’s live webinars? Watch them on-demand now!
0 Comments