Open Letter to the C-Suite Regarding Your Data Center26 min read

Welcome to my domain, esteemed C-suite readers. I am not sure how you found your way to my humble abode, but I am happy you are here. I have one question for you: Do you know what is going on in your data center(s)? I suspect you are adroitly fluent in what applications are measuring your inventory turns and customer retention and cost of sales and productivity and hopefully you have a “no news is good news” story on the actual physical plant. I suspect also you either know or can quickly lay your hands on spending and ROI/IRR figures for ICT equipment, software, enterprise-colocation-cloud deployment decisions, and “X”aaS investments. That’s why we call these facilities mission critical. However, do you know how much of your data center operating budget is probably unnecessary and how much of the non-ICT (not computing, communicating or storing) capital budget for your data center may be unnecessary?
The answer, I am sorry to say, for many is “a lot” – that could be thousands, hundreds of thousands or millions, depending on the scale of the operation. Because of all that variability, I do not plan to talk specific dollars and cents today. Since my purpose today is merely to “point,” and thereby hopefully stimulate some organizational introspection, I will not be taking a deep dive into technical detail; however, that detail is readily accessible in the bibliography at the end of this article. If a data center is always cold, or has cold spaces (aisles), then more than likely too much is being spent on operating cooling equipment and therefore it is likely an unnecessary capital budget was dedicated to the equipment to produce that cooling. Notice that I said “always cold;” that is an important distinction which will become clearer as we move through this discussion. There is nothing wrong with a cold data center on a cold day.
Almost all ICT equipment that has been residing in our data centers for some number of years now can operate happily ingesting “cooling” air up to 95˚F, and most newer equipment coming from established OEMs can be cooled by 104˚F air and some standard models can be cooled by air as warm as 113˚F. Despite those vendor specifications, as an industry we mostly remain reluctant to creep beyond the mid-to-upper 70s. Our behavior is driven by a variety of factors:
- A belief that server inlet air temperatures above 80˚F will reduce the long term health and reliability of our ICT equipment
- A belief that server inlet air temperatures above 80˚F will reduce the transactional performance of our ICT equipment
- A belief that server inlet air temperatures above some number (usually pegged at 77˚F) will cause fan speeds to increase to the point of negating economies otherwise derived from higher temperatures
- A belief that no one gets fired for keeping their data center from over-heating and thereby avoiding an outage of some kind (I absolutely support this one, though that needle can be moved and still result in job security.)
While it is true that operating a data center with very high server inlet temperatures 24/7 all year will reduce the expected reliability and life of our ICT equipment, I am not proposing such a practice, and I do not believe any hot-air loyalist is. Rather, the idea here is to take advantage of what Mother Nature is giving us to drive any one of various free cooling (economizer) architectures, whereby the data center temperature will follow Mother Nature’s ambient temperature, offset by the associated approach temperature. By approach temperature, practically speaking, we are just talking about the cumulative difference between A and B, where A = the temperature outside where it first contacts the data center mechanism and B = the maximum air temperature at a server inlet. These differences can be attributed to losses through heat exchangers, gains from inadvertent re-circulation, impact of condenser temperatures, and any other elements in the transfer of energy between outside and inside. A critical element of the cumulative approach temperature is the amount of variation inside the data center of the supply air, which is a function of airflow management and which I will address a little later,. Meanwhile, by way of example, if the outside temperature were 53˚F, we might expect a maximum server inlet temperature of 55˚F with airside economization and 60˚F with an air-to-air heat exchanger. Likewise, when the outside air is 85˚F, we could expect our maximum server inlet temperature to be 87˚F or 92˚F, respectively.
Figures 1-4 show how this temperature distribution actually plays out. Each figure shows the number of hours per year that might be expected for each maximum server inlet temperature for data centers in four different sample locations with four different types of economizer. Ambient temperatures have been factored by the relevant approach temperature. The hockey stick at 50˚F on the left of each chart merely reflects the fact that we will begin recirculating warm air at a certain point so we do not get below the allowable low-end threshold for Class A2 servers. The red vertical lines mark the upper and lower boundaries for the ASHRAE (American Society of Heating, Refrigeration and Air Conditioning Engineers) Technical Committee 9.9 (Mission Critical Facilities, Data Centers, Technology Spaces and Electronic Equipment) latest recommended temperature limits for data center equipment. The green vertical line marks the upper boundary for allowable temperatures for Class A2 servers. For reference and later discussion, the upper boundary for Class A3 servers, which are currently readily available in the market place, is 104˚F.
Long term server reliability is affected by inlet air temperature. All the major manufacturers collaborated on a methodology they call the “X Factor,” which provides a prediction for server reliability variations at different temperatures compared to a baseline steady-state 68˚F — improved reliability at lower temperatures and diminished reliability at higher temperatures. They provide example data for data centers in different climate areas showing improvements in some and worsening reliability in others for data centers that were operating without any air conditioning. Looking back at Figures 1-4, we see that the vast majority of hours in each location for each type of economizer is to the left of 68˚F, as well as to the left of the recommended range (red boundary), not to mention farther to the left of where many, if not most, data centers are currently operating.
Let me interject an important aside for my non-technical audience. When I mentioned where most data centers are operating in the previous paragraph, I am referring to server inlet temperature, not set point. Set point could be anywhere from 2˚F to 30˚F below the server inlet temperature, depending on quality of airflow management (more on that later) and whether it is a return or supply set point. Don’t be confused.
Let me return to the issue of server reliability and the “X” factor. Details on applying this methodology are explained in Thermal Guidelines for Data Processing Environments, 4th edition. Using that methodology on the temperature distributions in Figures 1-4 results in a prediction that server reliability would be improved in every scenario by allowing the data center to operate within the full allowable range for Class A2 servers (with 95˚F maximum) as compared to operating within the recommended range or at a constant 68˚F. There are exceptions; for example, I recently completed a study for a Hong Kong data center that predicted reduced reliability because of the combination of temperature and humidity. Nevertheless, for the most part, the argument that we are protecting and promoting server health and reliability with narrow and colder server inlet temperature bands just does not hold up.
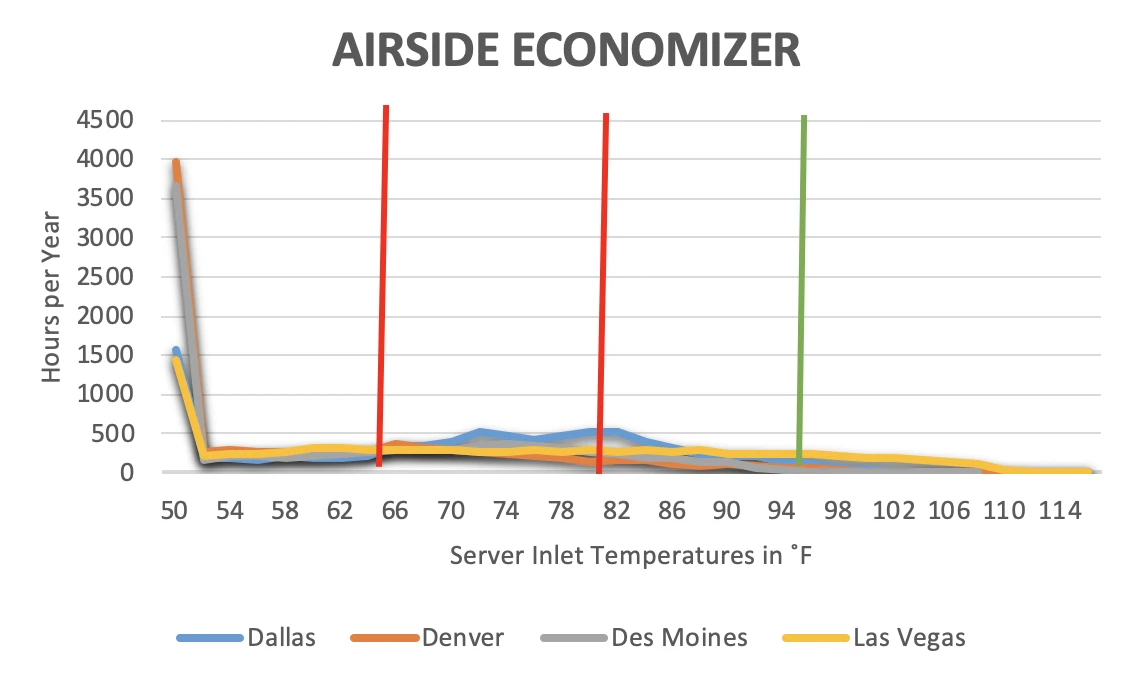
Figure 1: Hours at Different Server Inlet Temperatures for Airside Economization for Four Sample Data Centers
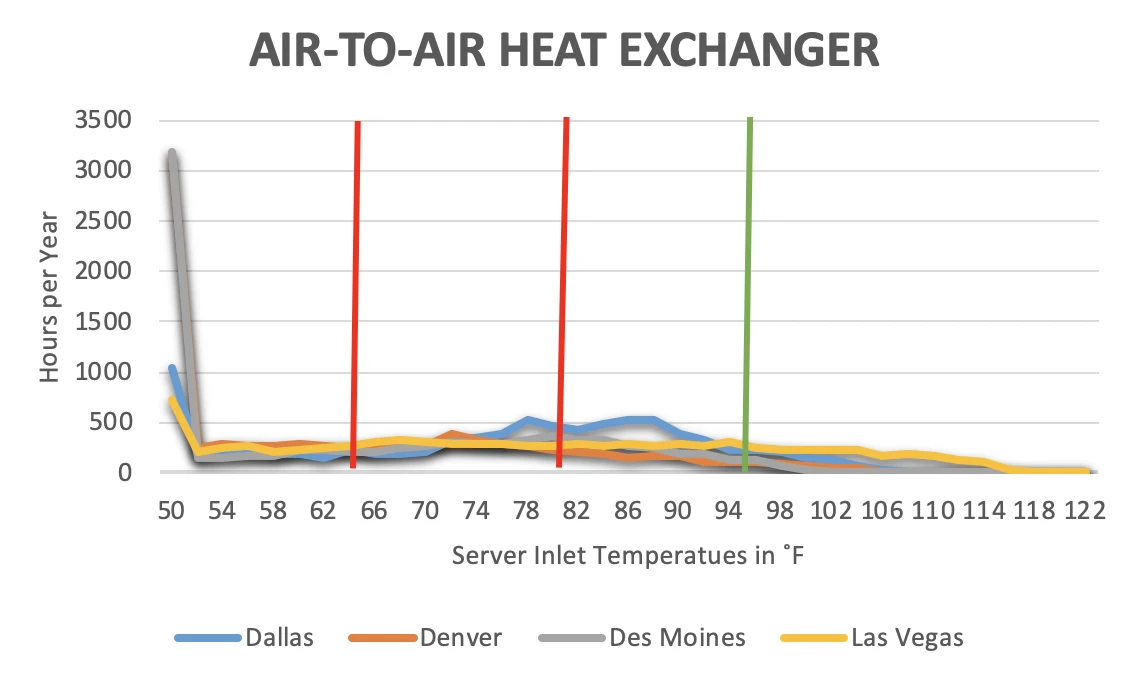
Figure 2: Hours at Different Server Inlet Temperatures for Air-to-Air Heat Exchanger Economization for Four Sample Data Centers
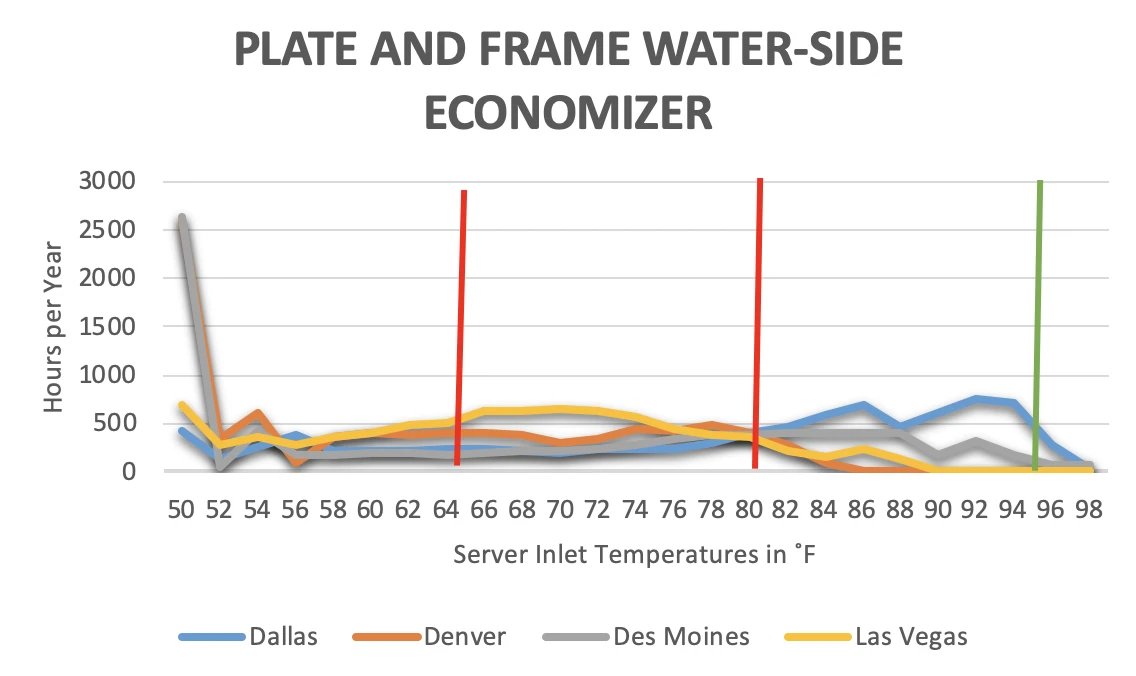
Figure 3: Hours at Different Server Inlet Temperatures for Plate and Frame Water-Side Economization for Four Sample Data Centers
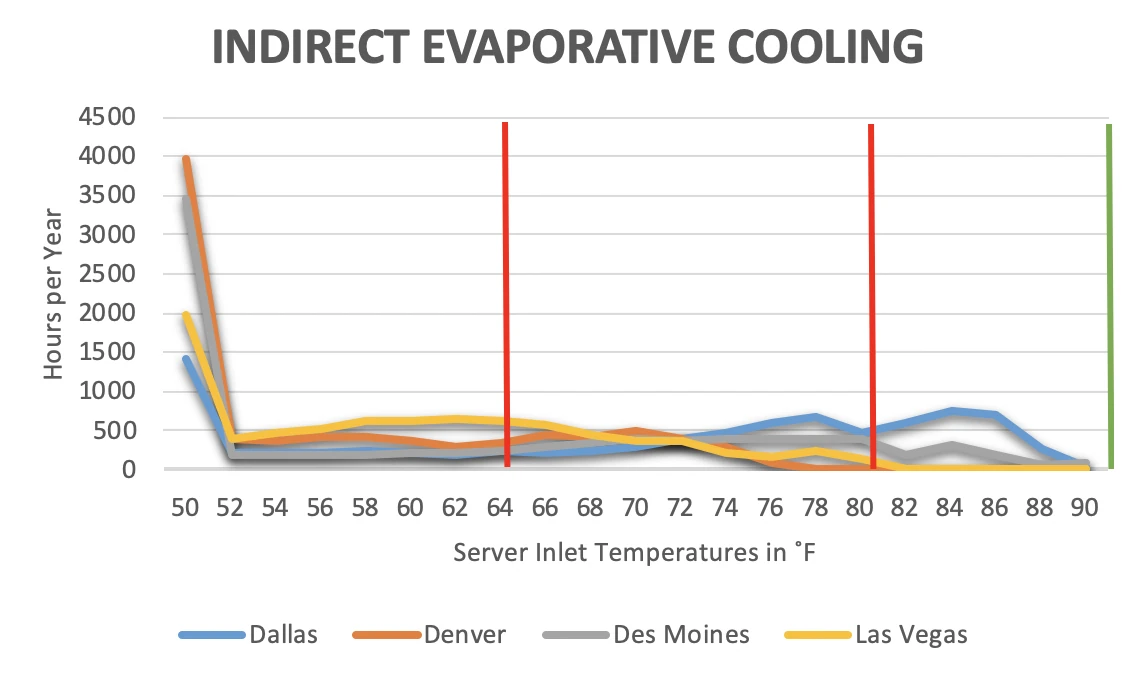
Figure 4: Hours at Different Server Inlet Temperatures for Indirect Evaporative Cooling Economization for Four Sample Data Centers
While it is true that extreme heat can slow down transactional speed of our processors, those temperatures must reach very extreme levels to be consequential. After all, our processors are typically rated in the 80˚-90˚C range (176˚-194˚F), so they can obviously get pretty hot before we would expect any drop-off in performance. Such an assumption is borne out by research conducted by the University of Toronto and IBM, cited in the attached references. In addition, referring back to Figures 1-4, the vast amount of server inlet temperature hours are to the far left of the allowable range so the overall effect of operating within the wider Class A2 allowable range, if anything, would actually be to improve server performance.
As server inlet temperatures increase, server fan speeds increase to help maintain a predictable heat transfer rate inside the server and across processors. The increased demand by server fans, in a well-tuned data center, will therefore produce an increased demand on the fans supplying air into the data center, resulting in a cumulative increase in fan energy. Nevertheless, the net effect on the data center in most cases will still be a net reduction in energy. For starters, we drop out the expense of operating a chiller and all associated refrigerant-based cooling equipment. A well-tuned, modern chiller could burn over 4000 kW hours per year per ton, which could be anywhere from 400,000 kW hours a year to over 8 million kW hours per year, depending on scale. In addition to those savings, remember that most of our hours are usually going to be on the far left of the scales in Figures 1-4, resulting in actually more fan savings at lower temperatures than there are fan penalties at higher temperatures.
Furthermore, there is a realistic opportunity in many situations to totally eliminate the capital expense of any refrigerant/tower cooling plant. In the examples presented in Figure 4, no chiller or any refrigerant cooling would be required in any of the four representative data center locations to maintain the Class A2 allowable maximum inlet temperature. In Figure 3, no chiller or any refrigerant cooling would be required in either Denver or Las Vegas. Note that Dallas and Des Moines would be OK within the Class A3 server allowable limit. While there are many such opportunities for totally eliminating the capital expense for legacy cooling equipment, even when the temperature distribution prevents 100% reliance on economizer cooling, the capital budget for cooling can still be minimized. For example, consider the blue line for Dallas in Figure 3. We have a total of 35 hours in which we have to drop the temperature 4˚F to stay within our allowable maximum and 281 hours in which we have to drop the temperature 2˚F. There is no way I need to invest in a complete mechanical plant for the total planned load of this data center. This is an engineering calculation and also a business decision regarding levels of redundancy, plus the engineering project to design an effective supply plenum to drop the overall supply temperature by mixing with a unit of chilled air. Regardless, whether this exercise results in a 90% reduction in the mechanical plant or only a 50% reduction, the savings will show up on both the operating side and the capital side.
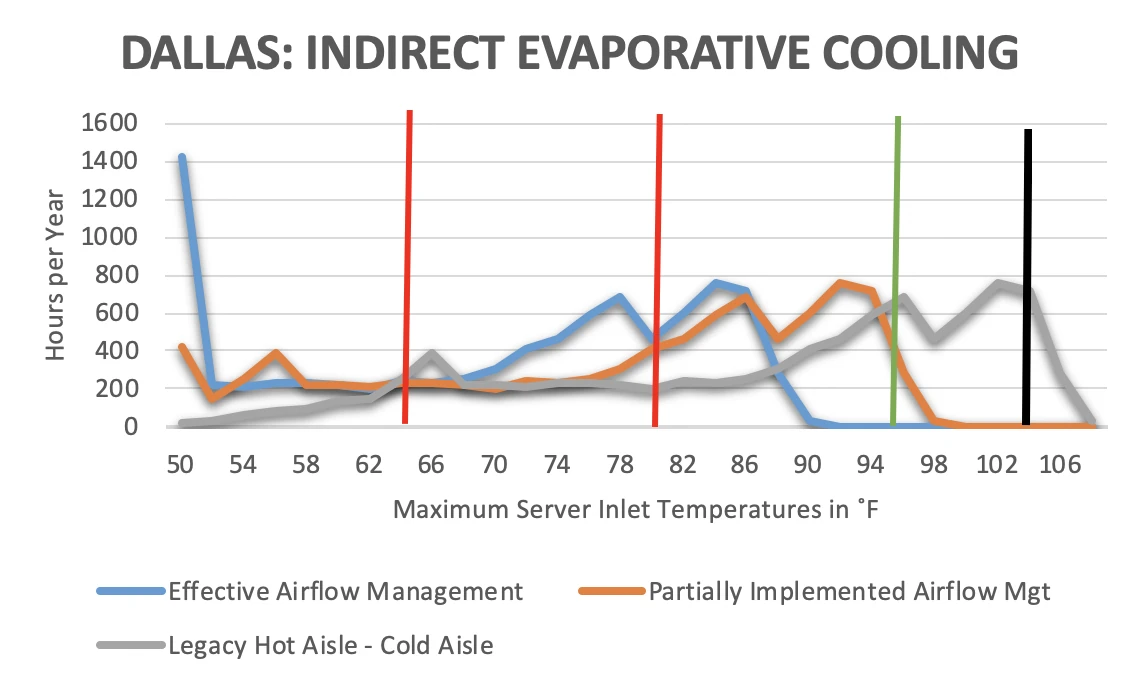
Figure 5: Hours at Different Server Inlet Temperatures for Indirect Evaporative Cooling Economization with Different Levels of Airflow Management Effectiveness
Finally, all the benefits I have discussed are contingent on the quality of airflow management in the data center. By airflow management, I am referring to the degree of separation between supply air and return air:
- We are not producing bypass air – supplying cooling air to the data center that bypasses heat load (short circuits the load) and returns to source without doing any work
- We are not re-circulating waste return air to contaminate our supply air and thereby raise some inlet temperatures resulting in a need to therefor supply cooler air
A good indicator of effective airflow management is the maximum variation in supply air temperature. Very effective separation will result in variations between supply air and highest server inlet of 2˚F. Partial separation could see variations as high as 5˚F and partially implemented partial separation could see variations closer to 8˚F. Legacy data centers with hot and cold aisles, haphazard deployment of blanking panels and access floor grommets and perhaps poorly integrated side-breathing switches could see variations running anywhere from 10˚F to over 30˚F. Figure 5 provides some visual evidence for the impact of airflow management. In this example, we are looking at a data center in Dallas deploying indirect evaporative cooling. With maximum effective airflow management, this data center would require no air conditioning to easily remain under the maximum allowable temperature limit for Class A2 servers. With partially implemented airflow management, 320 hours will exceed the Class A2 limit, but still be easily within the Class A3 maximum allowable limit (black vertical line). With a traditional hot aisle cold aisle data center with return set point, over 3500 hours would exceed the Class A2 upper limit and a requirement to drop temperatures 13˚F or more basically necessitates a full mechanical plant. Obviously, airflow management is critical to the whole endeavor.
I beg your indulgence for this rather lengthy revelation for folks who never have quite enough hours in the day. I just want to cover a couple more things that may be going on under the radar in the data center.
- Some data center managers believe their management does not care what is spent in the data center as long as they never hear about any problems.
- Some data center managers believe their management is extremely reluctant to approve spending for anything that does not directly address a mission critical objective, regardless of ROI or payback.
- There may still be data centers where the person responsible for the budget of energy saving hardware and systems is actually not responsible for the energy budget. You can guess where that goes. Let me close with just one short story about an IT manager in a data center for a major medical institution in Florida who I visited maybe a dozen years ago. After I walked her through how an investment in airflow management accessories and a particular economizer system would save her company over $10 million over the life of the data center, with a 14-15 month payback and wonderful ROI, she advised me that the electric bill was not in her department’s budget so she really didn’t care.
For the owner-operator of an enterprise data center, the above discussion and following bibliography provide a roadmap to maximizing both the operating efficiency and effectiveness of the mechanical plant. For current or prospective colocation tenants, your host likely knows everything I have covered here but they will not include it in their sales offering because they are convinced you will not understand it and divert your business to a reliably meat-locker data center environment. If you let them know that you understand that more than likely (do your own due-diligence) your ICT equipment would benefit from living in the broader allowable environmental envelope, you can share in the savings and the rest of us can benefit from the ever so slightly reduced carbon footprint of your combined activities.
Bibliography for Deeper Diving and Further Entertainment
“Impact of Temperature on Intel CPU Performance,” https://www.pugetsystems.com/labs/articles, Matt Bach, October 2014.
“Data Center Trends toward Higher Ambient Inlet Temperatures and the Impact on Server Performance,” Aparna Vallury and Jason Matteson, (IBM) Proceedings of the ASME 2013 International Technical Conference and Exhibition on Packaging and Integration of Electronic and Photonic Microsystems InterPACK2013 July 16-18, 2013.
“Temperature Management in Data Centers: Why Some (Might) Like It Hot,” Nosayba El-Sayed, Ioan Stefanovici, George Amvrosiadis, Andy A. Hwang, Bianca Schroeder, Department of Computer Science, University of Toronto, 2012.
“Dell’s Next Generation Servers: Pushing the Limits of Data Center Cooling Cost Savings,“ Jon Fitch, Dell Enterprise Reliability Engineering white paper, February, 2012.
HPE Proliant Gen 9 Server Extended Ambient Temperature Guidelines, Hewlett Packard Enterprise, Document Number 796441-009, 9th edition, June 2016
“2011Thermal Guidelines for Data Processing Environments – Expanded Data Center Classes and Usage Guidance,” White Paper, ASHRAE TC9.9
Thermal Guidelines for Data Processing Environments, 4th Edition, ASHRAE Technical Committee (TC) 9.9, Mission Critical Facilities, Data Centers, Technology Spaces, and Electronic Equipment, 2015, pages 11-36 and 109-127
NIOSH Criteria for a Recommended Standard: Occupational Exposure to Heat and Hot Environments. By Jacklitsch B, Williams WJ, Musolin K, Coca A, Kim J-H, Turner N. Cincinnati, OH: U.S. Department of Health and Human Services, Centers for Disease Control and Prevention, National Institute for Occupational Safety and Health, 2016
The Work Environment: Occupational Health Fundamentals, Volume 1, Doan J. Hansen, CRC Press, 1991
“Waterside and Airside Economizers Design Considerations for Data center Facilities,” ASHRAE Transactions 2010, Volume 116 part 1, (OR 10-012), Yuri Y. Lui
“Data Center Airflow Management at 100˚F”, Ian Seaton, Upsite Blog, May 29, 2019
“What Is the Difference between ASHRAE’s Recommended and Allowable Data Center Allowable Limits?,” Ian Seaton, Upsite Blog, October 9, 2019
Airflow Management Awareness Month 2019
Did you miss this year’s live webinars? Watch them on-demand now!

Ian Seaton
Data Center Consultant
Let's keep in touch!
Airflow Management Awareness Month 2019
Did you miss this year’s live webinars? Watch them on-demand now!
0 Comments